SQL-Engineering-Handbook
Table of Contents
- Overview
- Why Advanced Aggregations Matter
- Learning Objectives
- Skills Gained
- Prerequisites
- Folder Structure
- Module Contents
- Topic Walkthrough
- Function Reference
- Business Applications
- Analytics Engineering Perspective
- Performance Considerations
- Best Practices
- Common Mistakes
- Interview Preparation
- Career Relevance
- Difficulty & Time
- Full Handbook Map
- Further Reading
- Navigation
Overview
A single-column GROUP BY answers “what’s the total per category?” — the first question every analyst learns to write. This module covers everything that happens the moment a stakeholder asks a harder version of that question: a total per category broken down by a second category, several differently-defined metrics in the same row, a subtotal-and-grand-total report that used to take three separate queries, or a number with an actual business name — MRR, churn rate, ARPU — that leadership already tracks.
None of this is new relational theory. It’s the same GROUP BY you already know, aimed with more precision and combined with more judgment. That’s exactly what separates a beginner analyst’s query from an analytics engineer’s.
Why Advanced Aggregations Matter
Almost every dashboard, financial report, and executive summary in a real company is built from queries in this exact family:
- Multi-dimensional breakdowns — revenue by region and month, not just one or the other
- Composite metrics in one pass — count, sum, average, and distinct-count together, computed once
- Conditional metrics — new vs. returning, on-time vs. late, paid vs. failed, all in a single
GROUP BY - Hierarchical totals — subtotal and grand-total rows without stacking multiple queries by hand
- Named business KPIs — MRR, churn, ARPU, conversion rate — the specific numbers leadership already has a name for
Get the grain wrong here and a “total” silently becomes a subtotal, a dashboard panel double-counts a row, or a churn number quietly means something different than what the VP thinks it means. This module is about writing aggregation logic that a business can actually rely on.
Learning Objectives
By the end of this module, you will be able to:
- Reason correctly about grain in multi-column
GROUP BYqueries — what exactly one output row represents - Compute several independent metrics over the same group in a single pass, without repeated scans
- Use
CASE WHENinside aggregate functions to compute differently-filtered metrics side by side - Choose between
ROLLUP,CUBE, andGROUPING SETSfor hierarchical and custom subtotal reporting - Identify subtotal/grand-total rows with
GROUPING()instead of fragileNULLchecks - Translate a named business KPI (MRR, churn, ARPU) into precise, correct SQL
- Shape query output so it can be consumed directly by a BI tool without further transformation
- Take an ambiguous, real-world reporting brief and make and justify the grain, metric, and denominator decisions it requires
Skills Gained
- Multi-dimensional reporting query design
- Composite, single-pass metric computation
- Conditional aggregation for breakdown-by-status reporting
- Hierarchical subtotal/grand-total reporting with
ROLLUP/CUBE/GROUPING SETS - Translating business KPI definitions into precise SQL
- Designing BI-tool-ready, dashboard-shaped query output
- Making and defending grain, metric, and denominator decisions on ambiguous reporting briefs
Prerequisites
This module assumes completion of:
| Module | Why it’s needed here |
|---|---|
01–07 |
SELECT, filtering, sorting, basic aggregation, joins, CASE, subqueries/CTEs |
05_CASE_WHEN |
CASE WHEN logic is the mechanism behind every conditional aggregate in this module |
10_STRING_FUNCTIONS |
Formatting derived labels for reporting output |
11_NULL_HANDLING_AND_DATA_CLEANING |
Distinguishing real NULLs in source data from the structural NULLs ROLLUP/CUBE introduce |
Folder Structure
12_ADVANCED_AGGREGATIONS/
├── README.md                                     ← you are here
├── assets/                                        ← diagrams used in this README
│   ├── banner.svg
│   ├── 01_advanced_group_by.svg
│   ├── 02_multiple_aggregations.svg
│   ├── 03_conditional_aggregation.svg
│   ├── 04_rollup_cube_grouping_sets.svg
│   ├── 05_business_kpi_reports.svg
│   ├── 06_executive_dashboards.svg
│   └── 07_real_world_analytics_project.svg
├── 01_ADVANCED_GROUP_BY.md
├── 01_ADVANCED_GROUP_BY.sql
├── 02_MULTIPLE_AGGREGATIONS.md
├── 02_MULTIPLE_AGGREGATIONS.sql
├── 03_CONDITIONAL_AGGREGATION.md
├── 03_CONDITIONAL_AGGREGATION.sql
├── 04_ROLLUP_CUBE_GROUPING_SETS.md
├── 04_ROLLUP_CUBE_GROUPING_SETS.sql
├── 05_BUSINESS_KPI_REPORTS.md
├── 05_BUSINESS_KPI_REPORTS.sql
├── 06_EXECUTIVE_DASHBOARDS.md
├── 06_EXECUTIVE_DASHBOARDS.sql
├── 07_REAL_WORLD_ANALYTICS_PROJECT.md
└── 07_REAL_WORLD_ANALYTICS_PROJECT.sql
📋 Module Contents
Every file in this module, its business domain, and its size — so you know what you’re committing to before you open it.
| # | Topic (.md) |
Domain | .md lines |
.sql lines |
Combined size | Difficulty |
|---|---|---|---|---|---|---|
| 01 | Advanced GROUP BY · .sql |
Human Resources | 212 | 270 | 23.9 KB | 🟢 Foundational |
| 02 | Multiple Aggregations · .sql |
E-commerce | 202 | 168 | 19.6 KB | 🟢 Foundational |
| 03 | Conditional Aggregation · .sql |
Banking / Finance | 201 | 210 | 22.8 KB | 🟡 Intermediate |
| 04 | ROLLUP, CUBE & GROUPING SETS · .sql |
Retail | 214 | 232 | 23.8 KB | 🟠 Advanced |
| 05 | Business KPI Reports · .sql |
SaaS | 194 | 183 | 20.9 KB | 🟠 Advanced |
| 06 | Executive Dashboards · .sql |
Healthcare | 203 | 170 | 21.8 KB | 🟠 Advanced |
| 07 | Real-World Analytics Project (Capstone) · .sql |
Logistics / Supply Chain | 202 | 293 | 28.9 KB | 🔴 Capstone |
| — | Total | 7 domains | 1,428 | 1,526 | ~161.9 KB | — |
Every
.mdfile follows the same 19-section anatomy — Introduction → Concept Overview → Business Motivation → Why This Feature Exists → Real Company Examples → Business Problems Solved → Visual Explanation → Syntax → Detailed Walkthrough → Production Workflow → Analytics Engineering Perspective → Performance Considerations → Edge Cases → Common Mistakes → Best Practices → Interview Questions → Summary → Practice Challenges → Further Reading — so once you know the shape of one file, you know the shape of all seven.
🧭 Topic Walkthrough
01 — Advanced GROUP BY
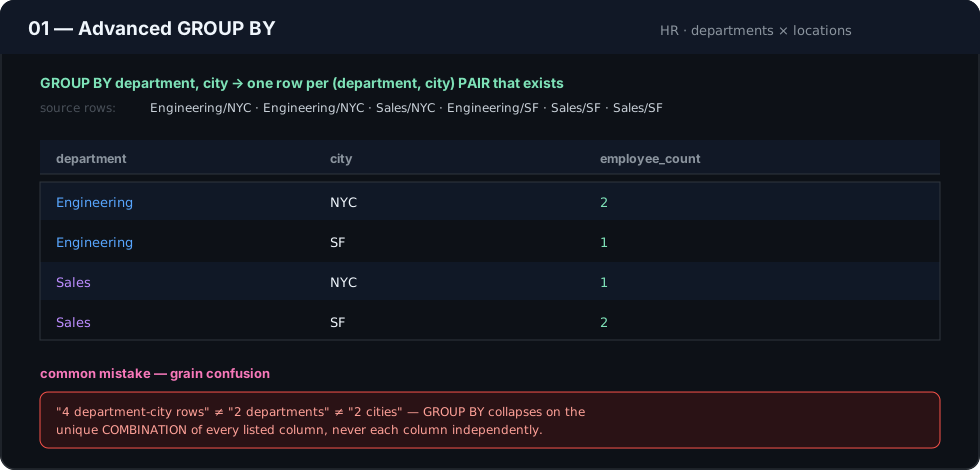
The core upgrade every beginner analyst has to make: from grouping by one column to grouping by a combination of columns. GROUP BY department, city collapses rows into one group per (department, city) pair that actually exists — not one group per department plus one group per city. This topic is entirely about grain discipline.
📄 01_ADVANCED_GROUP_BY.md · 🗄️ 01_ADVANCED_GROUP_BY.sql
02 — Multiple Aggregations
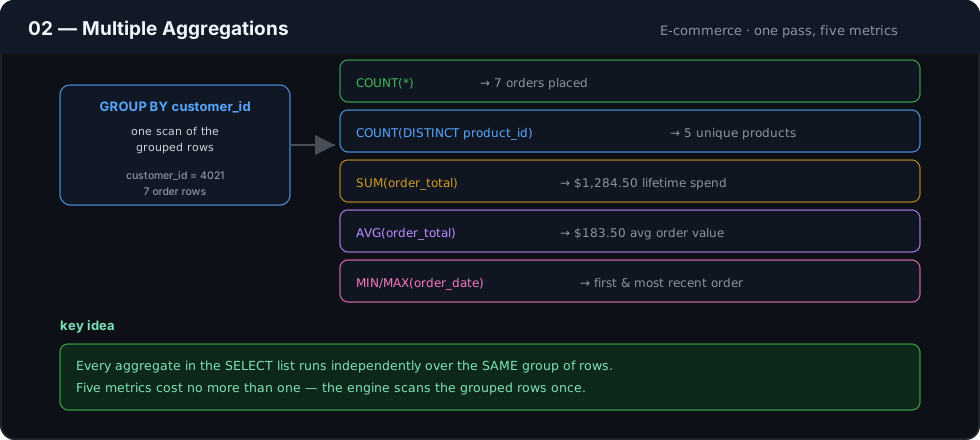
COUNT(), COUNT(DISTINCT), SUM(), AVG(), MIN(), and MAX() computed together in one GROUP BY pass. Every aggregate in the SELECT list runs independently over the same grouped rows — five metrics cost no more than one, because the engine scans the group once.
📄 02_MULTIPLE_AGGREGATIONS.md · 🗄️ 02_MULTIPLE_AGGREGATIONS.sql
03 — Conditional Aggregation
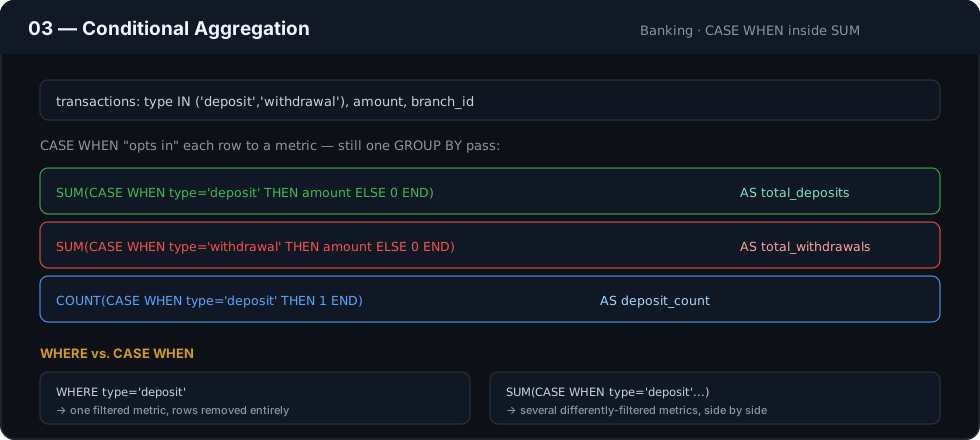
Puts CASE WHEN inside the aggregate function, so a single query computes several differently-filtered metrics side by side — the technique behind nearly every “breakdown by status” report: new vs. returning, deposits vs. withdrawals, on-time vs. late.
📄 03_CONDITIONAL_AGGREGATION.md · 🗄️ 03_CONDITIONAL_AGGREGATION.sql
04 — ROLLUP, CUBE & GROUPING SETS
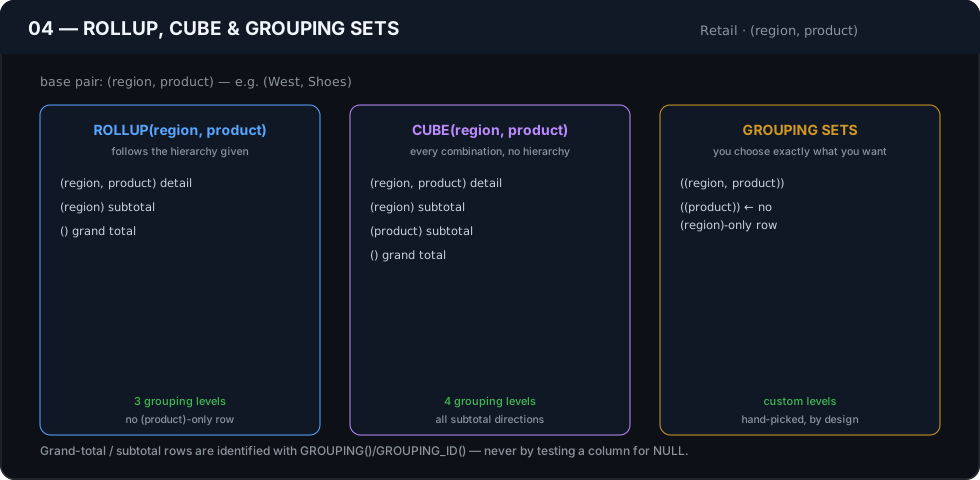
The three tools behind every finance report with subtotal rows and a grand total: ROLLUP follows the hierarchy of the columns given, CUBE produces every possible subtotal combination, and GROUPING SETS lets you hand-pick exactly which combinations you want. GROUPING() identifies subtotal/grand-total rows — never a NULL check.
📄 04_ROLLUP_CUBE_GROUPING_SETS.md · 🗄️ 04_ROLLUP_CUBE_GROUPING_SETS.sql
05 — Business KPI Reports
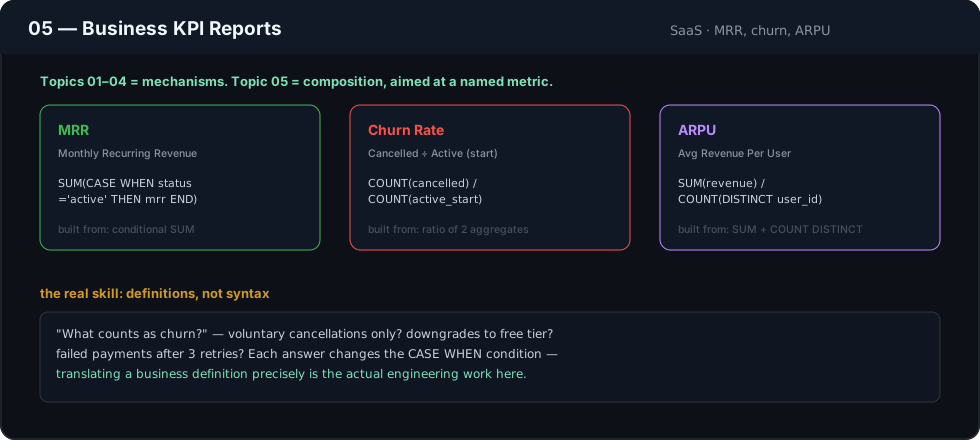
Where Topics 01–04 are mechanisms, this topic is composition — combining them deliberately to produce named business metrics: MRR, churn rate, ARPU, conversion rate. The engineering skill is translating a business definition (“what counts as churn?”) into a precise SQL condition, not new syntax.
📄 05_BUSINESS_KPI_REPORTS.md · 🗄️ 05_BUSINESS_KPI_REPORTS.sql
06 — Executive Dashboards
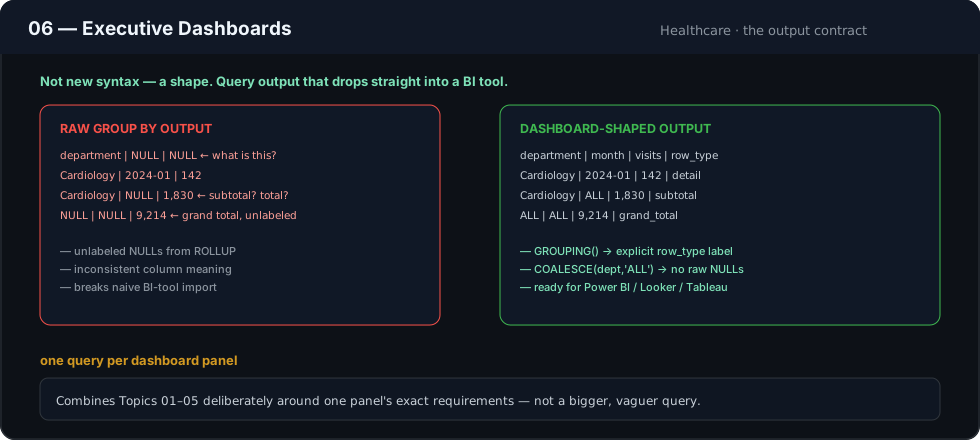
A dashboard is a KPI report designed to be consumed directly by a BI tool: predictable columns, no unexplained NULLs, subtotal/grand-total rows properly labeled. This topic is about designing the output contract — shaping the result set, not computing new numbers.
📄 06_EXECUTIVE_DASHBOARDS.md · 🗄️ 06_EXECUTIVE_DASHBOARDS.sql
07 — Real-World Analytics Project (Capstone)
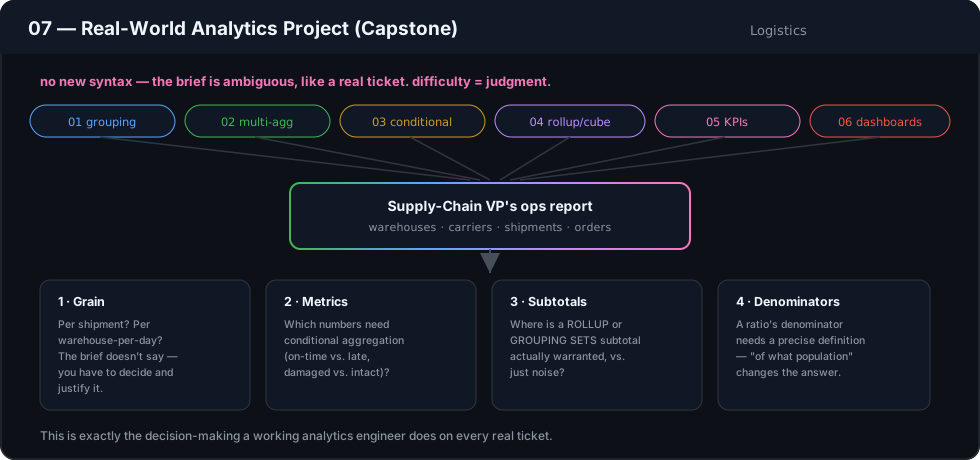
The capstone: every technique from Topics 01–06 comes together in one realistic engineering brief — build the logistics operations report a supply-chain VP would actually ask for. No new SQL syntax; the difficulty is entirely in grain decisions, metric selection, subtotal placement, and denominator definitions.
📄 07_REAL_WORLD_ANALYTICS_PROJECT.md · 🗄️ 07_REAL_WORLD_ANALYTICS_PROJECT.sql
🔤 Function Reference
Every clause and function taught in this module, grouped by what it does.
Grouping & Core Aggregates (Topics 01–02)
| Function / Clause | Purpose | |---|---| | `GROUP BY (col1, col2, ...)` | Aggregates across multiple dimensions simultaneously | | `COUNT()` / `COUNT(DISTINCT)` | Row counts and unique-value counts per group | | `SUM()` | Additive totals per group | | `AVG()` | Mean value per group | | `MIN()` / `MAX()` | Boundary values per group |Conditional & Hierarchical Aggregation (Topics 03–04)
| Function / Clause | Purpose | |---|---| | `CASE WHEN ... THEN ... END` (inside aggregates) | Conditional metrics within a single aggregation pass | | `ROLLUP(col1, col2, ...)` | Hierarchical subtotals + grand total, one dimension order | | `CUBE(col1, col2, ...)` | Every combination of subtotals across all listed dimensions | | `GROUPING SETS (...)` | Explicit, hand-picked set of grouping combinations | | `GROUPING(col)` | Returns `1` for subtotal/grand-total rows, `0` for detail rows | | `HAVING` | Filters groups *after* aggregation, unlike `WHERE` |Topics 05, 06, and 07 introduce no new functions — they are entirely about composing the clauses above into named KPIs, BI-ready dashboards, and a real-world reporting brief.
Business Applications
This module’s techniques map directly onto reports that exist in nearly every company with a data team:
- Revenue & finance — revenue by region × quarter with subtotals, profit margin by product line, budget-vs-actual rollups
- Retail & e-commerce — top/bottom performing SKUs, category performance, order-value segmentation
- Marketing — campaign performance with conditional conversion metrics, channel attribution summaries
- Human Resources — headcount by department × location, attrition rates, tenure distribution reports
- Banking & finance — transaction volume by branch × product, fraud-flag rate by conditional aggregation
- Healthcare — patient visit counts by department × month, readmission-rate KPIs
- Supply chain & logistics — on-time delivery rate by warehouse, shipment volume by carrier × region
- SaaS — MRR movement (new, expansion, contraction, churn) as a single conditional-aggregation query
Analytics Engineering Perspective
A data analyst writes a query to answer one question. An analytics engineer writes a query — or a dbt model, or a scheduled report table — that many people will query against for months or years. That distinction changes how you should think about everything in this module:
- Grain discipline. Know the intended grain of the output before writing a single
GROUP BY. Multi-column grouping makes it easy to accidentally produce a finer grain than intended, silently duplicating what looked like a total. - Idempotent aggregation. Scheduled reports re-run repeatedly.
ROLLUP/CUBEoutput should be deterministic and stable — the same inputs must always produce the same subtotal and grand-total rows, in a predictable shape. - Reusable metric definitions. Conditional aggregation logic (e.g., “what counts as a returning customer”) gets copy-pasted across a dozen reports. In a mature setup, that
CASElogic belongs in one tested definition — not re-typed slightly differently everywhere. - Separation of aggregation from presentation. SQL should produce correctly aggregated numbers. Formatting and subtotal labeling belong in the BI layer.
GROUPING()exists so SQL can flag “this is a subtotal row” without hardcoding a label like'All Regions'into the data.
Performance Considerations
- Multi-column
GROUP BYtypically requires sorting or hashing on the full combination of grouped columns — a composite index matching theGROUP BYorder can avoid an explicit sort step on large tables. ROLLUP/CUBEcompute multiple grouping levels in a single query, which is usually far cheaper than running several separateGROUP BYqueries andUNION-ing them — butCUBEon many columns grows combinatorially and can be expensive on wide dimension sets.HAVINGfilters after aggregation — it cannot use an index the way aWHEREclause on a raw column can. Filter as much as possible inWHEREbefore the aggregation runs.- Conditional aggregation (
CASE WHENinsideSUM/COUNT) is usually cheaper than the equivalent multiple-WHERE-clauseUNION ALLpattern, since it scans the source table once instead of N times.
Best Practices
- State the intended grain of a report as a comment above the query — “one row per (region, month)” — before writing the
GROUP BY. - Prefer
GROUPING()overNULLchecks to identify subtotal/grand-total rows; a realNULLin the source data and a structuralNULLfromROLLUPare otherwise indistinguishable. - Centralize repeated conditional-aggregation logic (e.g., a churn definition) in a view, CTE, or
dbtmacro rather than duplicating theCASE WHENacross reports. - Design KPI and dashboard queries around the output contract the consuming tool expects — labeled row types, no raw
NULLs, consistent column meaning — not just a correct number.
Common Mistakes
- Treating
GROUP BY col1, col2as two independent groupings instead of one grouping on the combined pair. - Using
WHEREto filter one metric on a multi-metric report, which removes rows needed by the other metrics in the same query — the fix is conditional aggregation, notWHERE. - Testing a
ROLLUP/CUBEcolumn forNULLto detect a subtotal row, which breaks the moment the source data legitimately containsNULLin that column. - Defining a ratio’s denominator ambiguously (“churn rate”) without specifying the population it’s measured against, producing a number two people can compute two different — both defensible — ways.
Interview Preparation
Interviewers commonly test this module through business scenarios rather than syntax recall: “show revenue by region and month with subtotals,” “compute new vs. returning customer counts in one query,” “what’s the difference between ROLLUP and CUBE,” or “how would you calculate churn rate and what assumptions does your definition make.” Each topic file in this module ends with an Interview Questions section modeled on exactly these patterns.
Career Relevance
Advanced aggregation is the single most common SQL skill gap between “can write a working query” and “can be trusted with a stakeholder-facing report.” Analysts, Analytics Engineers, and BI Engineers write this exact pattern — multi-column GROUP BY, conditional metrics, subtotal reporting — multiple times a week in production.
Production applications:
- Financial and executive reporting pipelines producing subtotal/grand-total tables on a schedule
- SaaS metrics dashboards computing MRR, churn, and ARPU directly from transactional data
- BI-layer views feeding Power BI, Looker, and Tableau dashboards without further transformation
- Operational reports (logistics, healthcare, retail) segmented by conditional business rules
Difficulty & Time
| Level | Advanced — assumes fluency with GROUP BY, joins, and CASE WHEN; introduces hierarchical aggregation (ROLLUP/CUBE/GROUPING SETS) and the judgment to compose it into real reports |
| Estimated time | 10–14 hours across all seven sub-modules, including the capstone project |
| Business domains used | Human Resources, E-commerce, Banking, Retail, SaaS, Healthcare, Logistics / Supply Chain |
🗂️ Full Handbook Map
Where this module sits in the complete SQL Engineering Handbook:
| # | Module | Contents | Status |
|---|---|---|---|
| 00 | Schema | Practice database DDL, seed data, and ERD used by every later module | ✅ |
| 01 | Fundamentals | SELECT, WHERE, ORDER BY, LIMIT, aliasing |
✅ |
| 02 | Aggregations | COUNT, SUM, AVG, MIN/MAX, GROUP BY, HAVING |
✅ |
| 03 | Joins | Inner, left, right, full, cross, self joins + performance audit | ✅ |
| 04 | Subqueries | Scalar, correlated, EXISTS, derived tables, subquery-to-join rewrites |
✅ |
| 05 | CASE WHEN | Conditional logic and business-rule encoding | ✅ |
| 06 | CTEs | Common Table Expressions, recursive CTEs | ✅ |
| 07 | Window Functions | ROW_NUMBER, RANK, LAG/LEAD, PARTITION BY |
✅ |
| 08 | Window Business Cases | Applied window-function scenarios (running totals, cohorts, rankings) | ✅ |
| 09 | Date Functions | Date arithmetic, formatting, range queries | ✅ |
| 10 | String Functions | String manipulation and data cleaning | ✅ |
| 11 | NULL Handling & Data Cleaning | COALESCE, NULLIF, data-quality patterns |
✅ |
| 12 | Advanced Aggregations (this module) | Multi-column GROUP BY, conditional aggregation, ROLLUP/CUBE, KPI reporting |
✅ |
| 13 | Set Operators | UNION, INTERSECT, EXCEPT, reconciliation queries |
✅ |
| 14 | Views | Views, security, updatable views, performance | ✅ |
| 15 | Indexes | B-Tree, composite, covering indexes, reading EXPLAIN |
✅ |
| 16 | Query Optimization | Execution plans, rewrite patterns, anti-patterns | ✅ |
| 17 | SQL Interview Questions | Curated question bank with worked answers | 📋 |
| 18 | SQL Business Case Studies | End-to-end analytics scenarios across domains | 📋 |
| 19 | SQL Projects | Portfolio-ready guided projects | 📋 |
| 20 | SQL Cheatsheet | One-page syntax and pattern reference | 📋 |
✅ Complete · 📋 Planned — live status always lives in ROADMAP.md.
Further Reading
- PostgreSQL — GROUPING SETS, CUBE, and ROLLUP
- MySQL — GROUP BY Modifiers (WITH ROLLUP)
- Microsoft Learn — GROUP BY (Transact-SQL)