SQL-Engineering-Handbook
07 · Real-World Analytics Project (Capstone)
🏠 Module Home · 🗂️ Handbook Home · ← 06 Executive Dashboards · Next → Module 13 Set Operators ▶
Module: 02 — Advanced Aggregations Domain used in this file: Logistics / Supply Chain (
warehouses,carriers,shipments,orders) Companion file:07_REAL_WORLD_ANALYTICS_PROJECT.sql
Introduction
This is the capstone for Module 02. Every technique from Topics 01–06 — multi-column GROUP BY, multiple aggregates in one pass, conditional aggregation, ROLLUP/CUBE/GROUPING SETS, KPI composition, and dashboard-shaped output — comes together here in a single, realistic engineering brief: build the logistics operations report a supply-chain VP would actually ask for.
Treat this file the way you would a real ticket: a business brief, ambiguous in places, that you have to turn into a precise, production-quality query — not a textbook exercise with the answer already implied by the chapter it’s in.
Concept Overview
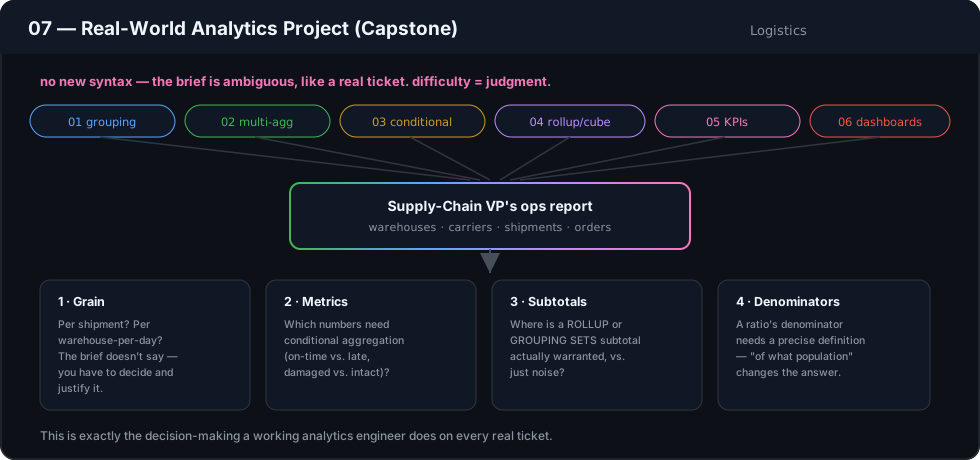
There is no new SQL syntax in this file. The capstone’s difficulty is entirely in composition and judgment: deciding which grain the report needs, which metrics require conditional aggregation, where a subtotal is warranted, and where a ratio’s denominator needs careful definition — exactly the decisions a working analytics engineer makes on every real ticket.
Business Motivation
The brief, as it would arrive from a stakeholder:
“I want one report: on-time delivery rate by warehouse and by carrier, shipment volume, and average delivery delay in days — for the current month, with a subtotal per warehouse and a company-wide total. I need to know, at a glance, which warehouse/carrier combinations are dragging down our SLA.”
This single paragraph requires: a two-dimension grain (warehouse × carrier), a conditional on-time rate, a volume count, an average delay metric, and a ROLLUP-based subtotal structure — the entire module, applied at once.
Why This Feature Exists
Real analytics work rarely arrives as “write a query using ROLLUP.” It arrives as a business sentence that has to be decomposed into exactly the right combination of the tools this module covers. This capstone exists to build that decomposition muscle — reading a business ask and mapping it onto grain, metrics, conditions, and totals, in that order.
Real Company Examples
- Logistics companies (FedEx/UPS-style operations reporting) — on-time delivery rate by hub and carrier, refreshed daily for operations leadership.
- Manufacturing supply chains — supplier on-time-in-full (OTIF) rate by supplier and plant, with regional subtotals.
- Retail distribution — fulfillment SLA compliance by distribution center and shipping method.
Business Problems Solved
- End-to-end SLA and operational performance reporting across two or more dimensions
- Root-cause identification (which specific warehouse/carrier combination is underperforming, not just the aggregate rate)
- Executive-ready reports with subtotals, suitable for direct BI-tool or PDF export
- The realistic “one ticket, many techniques” shape of actual analytics engineering work
Visual Explanation
┌──────────────────────────────────────────────────────────────────────┐
│  CAPSTONE REPORT: On-Time Delivery by Warehouse & Carrier (This Month) │
│                                                                          │
│  Warehouse     Carrier      Shipments   On-Time %   Avg Delay (days)    │
│  ──────────────────────────────────────────────────────────────────    │
│  Nagpur DC      CarrierX      1,204        94.2         0.3              │
│  Nagpur DC      CarrierY        860        81.5         1.4              │
│  Nagpur DC      (subtotal)     2,064        89.1         0.8              │
│  Pune DC        CarrierX        740        96.8         0.2              │
│  Pune DC        CarrierY        512        85.0         1.1              │
│  Pune DC        (subtotal)     1,252        92.0         0.6              │
│  ──────────────────────────────────────────────────────────────────    │
│  Company Total                3,316        90.5         0.7              │
└──────────────────────────────────────────────────────────────────────┘
Every row and subtotal above comes from one query, composing ROLLUP, conditional aggregation, and AVG() together — the full capstone deliverable, built step by step in the companion .sql file.
Syntax
No new syntax — this file composes the full toolkit from Topics 01–06 in one query:
SELECT
    COALESCE(w.warehouse_name, 'Company Total')                        AS warehouse,
    COALESCE(c.carrier_name,
             CASE WHEN GROUPING(w.warehouse_name) = 0
                  THEN 'Subtotal' END)                                    AS carrier,
    COUNT(sh.shipment_id)                                                 AS total_shipments,
    ROUND(100.0 * COUNT(CASE WHEN sh.delivered_date <= sh.promised_date
                             THEN 1 END)
          / NULLIF(COUNT(sh.shipment_id), 0), 1)                            AS on_time_pct,
    ROUND(AVG(GREATEST(sh.delivered_date - sh.promised_date, 0)), 1)         AS avg_delay_days
FROM shipments  AS sh
JOIN warehouses AS w ON sh.warehouse_id = w.warehouse_id
JOIN carriers   AS c ON sh.carrier_id   = c.carrier_id
WHERE sh.promised_date >= DATE_TRUNC('month', CURRENT_DATE)
GROUP BY ROLLUP(w.warehouse_name, c.carrier_name);
Detailed Walkthrough
This is broken down step by step in the companion .sql file’s four scenarios, mirroring how a real ticket would actually be built:
- Scenario 1 establishes the base grain and core metrics (shipment volume, on-time rate) at the warehouse × carrier level — the Topic 01/03 foundation.
- Scenario 2 adds the
ROLLUP-based subtotal and grand-total structure — Topic 04 applied to the Scenario 1 base. - Scenario 3 adds a second KPI dimension (average delay in days, and a “chronically late” carrier flag) — Topic 05’s KPI-composition skill.
- Scenario 4 assembles the final, dashboard-shaped deliverable — clean labels,
GROUPING()-aware formatting, and a single query ready to hand to a BI tool, per Topic 06.
Read all four scenarios in the companion file in order — they build on each other exactly the way a real analytics ticket evolves through review feedback.
Production Workflow
This exact report would typically be built once, reviewed by the requesting stakeholder against a sample of known shipments (a sanity check), then scheduled as a nightly job that refreshes a summary table consumed by the operations BI dashboard — the same production path described throughout this module’s earlier topics, now applied end to end.
Analytics Engineering Perspective
- Start from the business sentence, not the SQL clause. Identify grain first (“warehouse and carrier”), then metrics (“on-time rate, volume, delay”), then structure (“subtotal per warehouse, grand total”) — in that order, every time.
- Confirm ambiguous definitions before writing the query. “On-time” could mean delivered on or before the promised date, or within some grace window — this capstone assumes the former, but a real ticket requires confirming it, not assuming it.
- A capstone-quality query survives a stakeholder staring at it. Every label should be self-explanatory, every subtotal clearly marked, and every number traceable back to a specific, stateable definition.
Performance Considerations
- This report joins three tables and computes both
ROLLUPsubtotals and a conditional-aggregation ratio — confirm indexes onshipments(warehouse_id, carrier_id, promised_date)before running against a production-scale shipments table. - If refreshed frequently (e.g., hourly during peak shipping season), materialize this exact query’s output into a summary table rather than recomputing the full join and rollup on every dashboard load.
- Scope with
WHEREto the current month before aggregating — never compute a rollup over the full shipment history when only the current month is needed.
Edge Cases
- Carrier/warehouse combinations with very low shipment volume can show a misleadingly extreme on-time percentage (e.g., 100% on 2 shipments) — consider whether the report should flag low-volume combinations rather than presenting them at equal visual weight to high-volume ones.
- A shipment with a
NULLdelivered_date(still in transit) should not count as “on time” or “late” — confirm it’s excluded from the on-time percentage’s numerator and denominator correctly, not silently miscounted. - Negative delay values (delivered early) should not be allowed to offset late shipments in an average delay calculation, unless the business specifically wants a net figure — the
GREATEST(..., 0)pattern in the syntax example above is one way to floor early deliveries at zero delay.
Common Mistakes
- Jumping straight to writing
ROLLUPsyntax before confirming the base grain and metrics are correct — subtotaling the wrong base query just produces confidently wrong subtotals. - Leaving in-transit shipments (
NULLdelivered_date) uncounted for volume but silently included in the on-time-rate calculation, or vice versa — decide and document the treatment explicitly. - Shipping a report with an unconfirmed definition of “on time,” then having to walk back a number a director already quoted upward.
Best Practices
- Build capstone-scale reports the way this file’s scenarios are structured: base grain and metrics first, then structure (subtotals), then supporting KPIs, then final presentation formatting — reviewing at each stage.
- Confirm every ambiguous business term (“on time,” “active,” “this month”) in writing before finalizing the query.
- Flag low-volume groups in any rate-based report rather than presenting them with the same visual confidence as high-volume groups.
- Treat the finished capstone query as something you would defend, line by line, in a pull request review.
Interview Questions
- Walk through how you would approach turning a vague stakeholder request into a precise SQL report. Identify the required grain first, then the specific metrics needed, then whether subtotals/totals are required, confirming ambiguous business definitions before writing any SQL.
- Why is a low-volume group’s rate metric potentially misleading in a report like this one? A rate computed over very few observations (e.g., 100% on-time out of 2 shipments) carries far less statistical weight than the same rate over thousands of shipments, but looks identical in a simple percentage column.
- How would you handle in-transit shipments with no delivery date yet in an on-time-rate calculation? Exclude them from both the numerator and denominator explicitly — they haven’t yet succeeded or failed the SLA, and including them either way would bias the rate.
- What’s the risk of building the
ROLLUP/subtotal structure before validating the base, non-rolled-up metrics? Any error in the base grain or conditional logic propagates into every subtotal and the grand total, and can be harder to spot in an already-aggregated summary row than in the detail rows. - How would you decide between a rolling window and a calendar-month scope for “this month” in a report like this? Confirm directly with the stakeholder — both are valid interpretations, and the difference materially changes the reported numbers, especially mid-month.
Summary
This capstone is Module 02 applied the way it would actually be used: starting from an ambiguous business ask, deciding the correct grain, layering in conditional metrics and hierarchical totals, and finishing with a clean, dashboard-ready result set. The four scenarios in the companion .sql file walk through that exact process step by step — read them as a sequence, not as four independent examples.
Practice Challenges
- Extend the capstone report to add a
low_volume_flagcolumn, marking any warehouse/carrier combination with fewer than 20 shipments this month. - Rebuild the capstone using
GROUPING SETSinstead ofROLLUP, producing only warehouse-level and grand-total rows (skipping the carrier-level detail) — and explain when a stakeholder might actually want this narrower version. - Add a week-over-week trend comparison to the capstone: this month’s on-time rate versus last month’s, side by side, for each warehouse/carrier combination.
- Write a one-paragraph brief (in the style of this file’s Business Motivation section) for a completely different capstone in a domain of your choice, and identify which Module 02 techniques it would require.
- Review the companion
.sqlfile’s four scenarios and write, in your own words, what each one adds on top of the previous one — this is the skill of reading and reviewing someone else’s analytics engineering work.
Further Reading
- PostgreSQL Documentation — Full-Text and Aggregate Query Patterns
- MySQL 8.0 Reference Manual — GROUP BY Modifiers
- Microsoft Learn — Designing Effective Operational Reports
◀ Previous: 06_EXECUTIVE_DASHBOARDS.md · Back to: Module README