SQL-Engineering-Handbook






Part of the SQL Engineering Handbook
Bridging syntax and real-world analytics. This module does not teach you what a window function is — Module 07 already did that. This module teaches you where, why, and how window functions are used inside real companies — in HR systems, sales pipelines, e-commerce platforms, banking cores, and finance departments.
Why This Module Exists
Every SQL engineer eventually learns the syntax of ROW_NUMBER(), RANK(),
LAG(), and SUM() OVER (...). Very few are taught why an analytics
team would reach for one over the other, or what business question
each pattern actually answers.
That gap is why candidates who can recite window function syntax in an interview still struggle to write a query that solves an actual leadership request like:
- “Show me the top 2 earners in every department.”
- “What’s our running revenue this quarter, and how does it compare to last year?”
- “Flag any account with unusually large transactions relative to its own history.”
Window functions are the backbone of modern analytics engineering because
they let you compare a row to its peers, its past, and its group —
without collapsing the dataset. Unlike GROUP BY, which flattens data
into summaries, window functions preserve row-level granularity while
attaching aggregate, ranking, and offset context to each row — exactly the
shape of data that feeds dashboards, leaderboards, cohort reports, and
anomaly-detection systems.
This module is organized around five business domains that, together, cover the vast majority of window function use cases you’ll encounter in industry: HR, Sales, E-Commerce, Banking, and Finance. One structural pattern — peer comparison, time comparison, or self comparison — repeats across all five; only the business vocabulary changes.
Who This Is For
Learners who’ve completed Module 07 — Window Functions and are fluent, not just familiar, with:
- Ranking functions:
ROW_NUMBER(),RANK(),DENSE_RANK(),NTILE() - Offset functions:
LAG(),LEAD() - Aggregate window functions:
SUM(),AVG(),COUNT(),MIN(),MAX()used withOVER (...) PARTITION BYandORDER BYinside a window specification- Basic frame clauses:
ROWS BETWEEN ... AND ... - Joins, CTEs (Module 06), and subqueries
If any of these feel unfamiliar, revisit Module 07 before continuing — this module assumes fluency, not familiarity.
Quick Start
This module runs against the shared practice schema defined in
00_Schema:
mysql -u root -p your_database < ../00_Schema/01_CREATE_TABLES.sql
mysql -u root -p your_database < ../00_Schema/02_INSERT_DATA.sql
mysql -u root -p your_database < 01_HR_ANALYTICS.sql
Each domain’s .sql file runs independently — no setup is required between
chapters, though working through them in order (01 → 05) is strongly
recommended, since each chapter explicitly reuses a pattern from the one
before it.
What This Module Covers
| # | Domain | File | Diagram | Lines | Size |
|---|---|---|---|---|---|
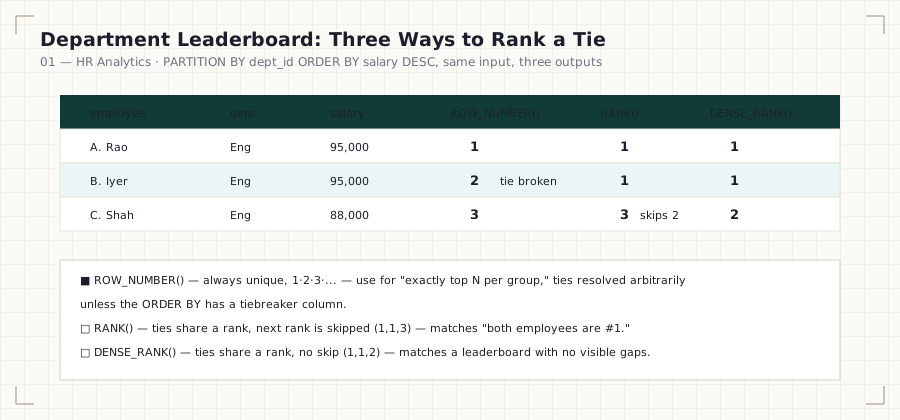
| 01 | HR Analytics | .md · .sql |
hr-leaderboard-tiebreak.svg | 136 + 268 | 8.9 KB + 9.0 KB |
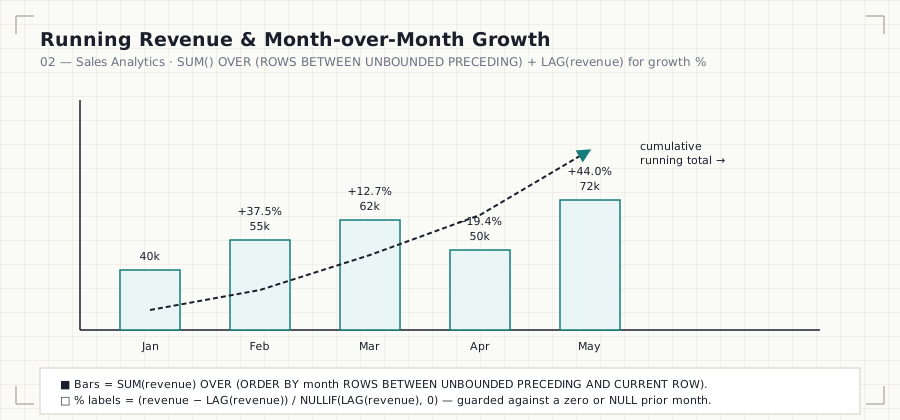
| 02 | Sales Analytics | .md · .sql |
sales-running-total-growth.svg | 134 + 232 | 8.3 KB + 7.7 KB |
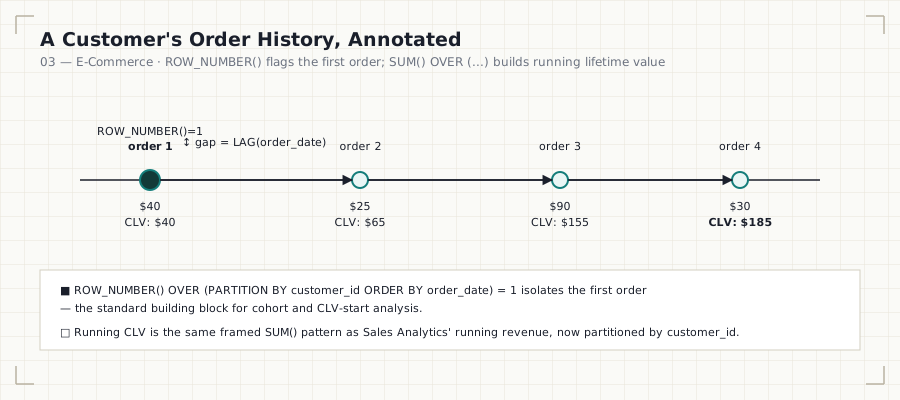
| 03 | E-Commerce | .md · .sql |
ecommerce-customer-lifecycle.svg | 131 + 244 | 8.2 KB + 7.9 KB |
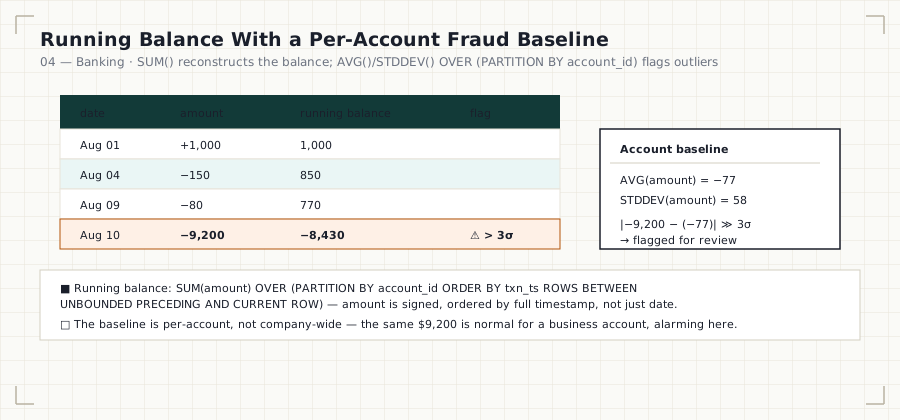
| 04 | Banking | .md · .sql |
banking-balance-outlier.svg | 129 + 241 | 9.3 KB + 8.7 KB |
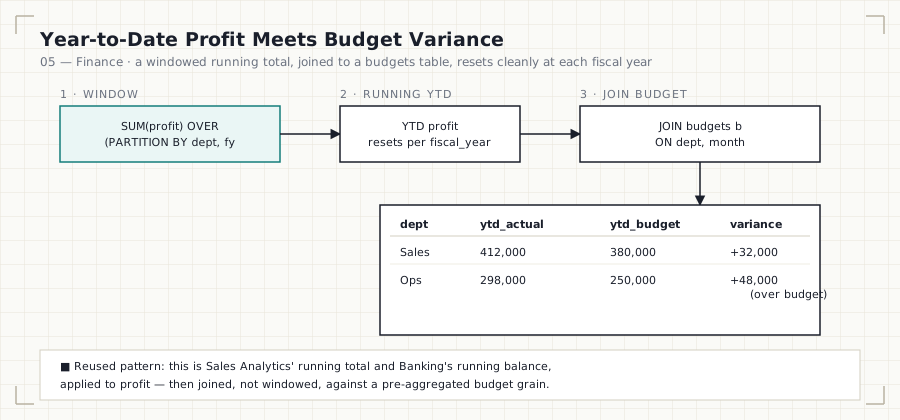
| 05 | Finance | .md · .sql |
finance-ytd-variance.svg | 128 + 277 | 9.0 KB + 10.2 KB |

Totals: 5 .md files, 5 .sql files, 6 diagrams (5 topic diagrams + 1
banner) — 1,920 combined lines, ~87.2 KB of documentation and runnable SQL.
Each .md file explains the business context, KPIs, dashboards, and
reasoning; each paired .sql file contains the fully commented,
production-quality query chapter for that domain.
The Diagrams
Every diagram in this module is a standalone SVG in
assets/diagrams/, embedded directly in its
corresponding chapter — no external image hosting, so they render correctly
on GitHub, cloned locally, or on GitHub Pages.




Business Domains Covered
| # | Domain | Core Business Questions |
|---|---|---|
| 01 | HR Analytics | Who are our top performers? Who’s eligible for promotion? How is compensation distributed by department? |
| 02 | Sales Analytics | Who is our top salesperson this month? What’s our revenue trend? How does this quarter compare to last year? |
| 03 | E-Commerce | Who are our highest-LTV customers? What’s our repeat purchase rate? Which products dominate each category? |
| 04 | Banking | What are our largest transactions? Is this account behaving abnormally? What’s the running balance over time? |
| 05 | Finance | Are we over budget? What’s our running profit? How volatile is our expense variance month to month? |
Learning Objectives
By the end of this module, you will be able to:
- Map a business requirement (“leaderboard,” “running total,” “cohort comparison”) directly to the correct window function pattern.
- Choose correctly between
ROW_NUMBER(),RANK(), andDENSE_RANK()based on how ties should be handled in a business context. - Build running totals, moving averages, and period-over-period growth metrics (MoM, QoQ, YoY) used in real dashboards.
- Use
LAG()/LEAD()to build comparison reports (previous transaction, next event, sequential gap analysis). - Apply window functions to detect anomalies and outliers (e.g., fraud signals in banking data).
- Reason about the performance implications of partitioning, ordering, and frame clauses at scale.
- Answer window-function interview questions with business framing, not just syntax recall.
Window Functions Used Across This Module
| Function | Primary Use Case in This Module |
|---|---|
ROW_NUMBER() |
Unique sequencing, deduplication, “top N per group” |
RANK() |
Leaderboards where ties should share a rank and skip subsequent ranks |
DENSE_RANK() |
Leaderboards where ties should share a rank without skipping |
NTILE() |
Percentile buckets (e.g., performance quartiles, customer tiers) |
LAG() / LEAD() |
Period-over-period comparisons, transaction gap analysis, sequential trend detection |
SUM() OVER (...) |
Running totals, running balances, cumulative revenue |
AVG() OVER (...) |
Moving averages, smoothed trend lines, per-account statistical baselines |
COUNT() OVER (...) |
Group-level counts without collapsing row-level detail |
FIRST_VALUE() / LAST_VALUE() |
Baseline comparisons (e.g., first transaction vs. most recent) |
Skills Gained
| Skill Category | What You Will Practice |
|---|---|
| Analytics Engineering | Translating KPIs into window function queries |
| Data Engineering | Writing performant, partition-aware SQL over large tables |
| Business Analysis | Understanding what each metric means to a stakeholder |
| SQL Architecture | Structuring multi-CTE, multi-scenario analytical queries |
| Interview Readiness | Explaining tradeoffs, not just producing correct output |
Learning Path
Work through the domains in order — each one reinforces the previous while introducing a new analytical pattern:
- HR Analytics — foundational ranking, leaderboard, and peer-comparison patterns.
- Sales Analytics — time-based patterns: running totals, MoM/YoY growth, moving averages.
- E-Commerce — customer-centric patterns: lifetime value, repeat behavior, basket analysis.
- Banking — sequential and anomaly patterns: running balances, transaction gaps, fraud signals.
- Finance — variance and budget patterns: running profit, budget-to-actual tracking; the capstone that reuses every prior pattern.
Each .sql file is organized into scenarios, and each scenario opens with
a business explanation before progressively more advanced queries.
Estimated Completion Time
| Domain | Estimated Time |
|---|---|
| HR Analytics | 60–75 minutes |
| Sales Analytics | 75–90 minutes |
| E-Commerce | 75–90 minutes |
| Banking | 60–75 minutes |
| Finance | 60–75 minutes |
| Total Module | ~6–7 hours |
Difficulty
Intermediate → Advanced. This module assumes syntax fluency and focuses entirely on application, judgment, and performance reasoning. Difficulty increases within each file as scenarios move from single- partition ranking to multi-metric, multi-window analytical reports.
Best Practices Reinforced in This Module
- Always define an explicit
ORDER BYinsideOVER (...)when using ranking or offset functions — undefined order produces non-deterministic results. - Prefer
ROW_NUMBER()overRANK()/DENSE_RANK()when you need exactly one row per group (“top 1 per department”), since ties inRANK()can return more rows than expected. - Be explicit about frame clauses (
ROWS BETWEEN ...) when computing running totals or moving averages — the default frame can silently produce incorrect results whenORDER BYis present. - Filter the output of a window function using a CTE or subquery — window
functions cannot be referenced directly in a
WHEREclause. - Partition only on columns that reflect the actual business grouping — over-partitioning fragments the window and under-partitioning produces misleading aggregates.
- Index the columns used in
PARTITION BYandORDER BYwhere possible; window functions still benefit heavily from sort-friendly access paths.
Common Mistakes (Module-Wide)
- Using
RANK()where the business wants exactly N rows per group — ties can silently return more than N. - Omitting an explicit frame clause and assuming
SUM() OVER (...)always returns the full partition total. - Applying a single company-wide baseline (average, standard deviation) for anomaly detection instead of a per-entity baseline — see Banking’s per-account fraud screen.
- Trying to filter directly on a window function in the same
SELECT’sWHEREclause — this requires a CTE or subquery. - Forgetting that a running total needs to reset at a natural boundary (fiscal year, per-customer) — see Finance’s YTD partitioning note.
Real-World Applications
Window functions in this module map directly to systems you will build or maintain on the job:
- HR dashboards showing department leaderboards and promotion eligibility lists.
- Sales performance dashboards used in weekly and monthly business reviews.
- Customer analytics platforms computing lifetime value and cohort retention.
- Fraud detection pipelines flagging transactions that deviate from a customer’s own history.
- Financial reporting systems tracking budget variance and running profit for leadership review.
How This Module Prepares You
For Data Analytics — you’ll independently translate a stakeholder’s question into a correct, efficient window function query, the single most common analytics interview and on-the-job task.
For Data Engineering — you’ll understand the performance cost of partitioning and ordering at scale, which directly informs how you design tables, indexes, and materialized views feeding these queries.
For Analytics Engineering — you’ll be able to build reusable, well-documented SQL models (dbt-style) where window functions form the core transformation logic for a metrics layer.
For SQL Interviews — you’ll be ready for the most commonly asked interview pattern across FAANG and mid-size tech companies — “Write a query to find the top N per group” — along with its many variations (running totals, YoY growth, gap analysis).
Module Checklist
- Every
.sqlfile runs cleanly against the shared00_Schemasetup - Every
.mdfile follows a consistent template: Introduction → Business Background → KPIs → Dashboards → Business Problems → Why Window Functions Are Needed → Functions Used → SQL Concepts Reinforced → Performance Notes → Common Mistakes → Interview Questions → Summary → Further Practice - Every chapter has a matching, embedded SVG diagram in
assets/diagrams/— rendered inline, not just linked - Each domain explicitly cross-references the pattern it reuses from an earlier chapter (e.g., Finance names exactly which prior chapter each of its patterns comes from)
- Performance notes present in every chapter — partitioning cost, indexing guidance, and when to materialize vs. recompute
Further Reading
- PostgreSQL Documentation — Window Functions
- Use The Index, Luke — Window Functions and Performance
- SQL for Data Analysis (O’Reilly) — chapters on window functions and cohort analysis
- Your database vendor’s official execution-plan documentation, to study how window functions are physically executed (sort, partition, and window-aggregate nodes)
Handbook Navigation
This module is one part of the full SQL Engineering Handbook — a
16-module, progressively-built curriculum sharing a single practice schema
(00_Schema) end to end.
| # | Module | Contents | Status |
|---|---|---|---|
| — | Resources | Books, blogs, docs, certifications, communities, datasets | ✅ |
| 00 | Schema | Practice database DDL, seed data, and ERD used by every later module | ✅ |
| 01 | Fundamentals | SELECT, WHERE, ORDER BY, LIMIT, aliasing |
✅ |
| 02 | Aggregations | COUNT, SUM, AVG, MIN/MAX, GROUP BY, HAVING |
✅ |
| 03 | Joins | Inner, left, right, full, cross, self joins + performance audit | ✅ |
| 04 | Subqueries | Scalar, correlated, EXISTS, derived tables, subquery-to-join rewrites |
✅ |
| 05 | CASE WHEN | Conditional logic and business-rule encoding | ✅ |
| 06 | CTEs | Common Table Expressions, staged pipelines, business classification | ✅ |
| 07 | Window Functions | ROW_NUMBER, RANK, LAG/LEAD, PARTITION BY |
✅ |
| 08 | Window Business Cases (this module) | HR, Sales, E-Commerce, Banking, and Finance window-function case studies | ✅ |
| 09 | Date Functions | Date arithmetic, formatting, range queries | ✅ |
| 10 | String Functions | String manipulation and data cleaning | ✅ |
| 11 | NULL Handling & Data Cleaning | COALESCE, NULLIF, data-quality patterns |
✅ |
| 12 | Advanced Aggregations | Conditional and multi-level aggregation | ✅ |
| 13 | Set Operators | UNION, INTERSECT, EXCEPT, reconciliation queries |
✅ |
| 14 | Views | Views, security, updatable views, performance | ✅ |
| 15 | Indexes | B-Tree, composite, covering indexes, reading EXPLAIN |
✅ |
⬅ 07 — Window Functions · Handbook Home · 09 — Date Functions ➡