SQL-Engineering-Handbook
05 · Finance — Window Functions in Budgeting & Profitability Analysis
Introduction
If Sales Analytics (Chapter 02) taught you to track revenue over time, Finance closes the loop by tracking profit, expense, and budget variance over the same time dimension - but with a critical difference: finance teams almost always need to compare an actual number to a planned number, not just to a prior period. This chapter combines every pattern built so far - running totals, period-over-period comparison, and leaderboard ranking - into the reporting structure finance and FP&A (Financial Planning & Analysis) teams present to leadership every month.
Business Background
A typical finance reporting schema centers on a ledger of actuals, often paired with a budget table:
financial_transactions (transaction_id, department_id FK, transaction_date, amount, transaction_type)transaction_typedistinguishes revenue, expense, etc.
departments (department_id, department_name)budgets (budget_id, department_id FK, budget_month, budgeted_amount, budget_type)
FP&A teams consume this data primarily through monthly rollups, running (year-to-date) totals, and variance against budget.
Typical KPIs
- Monthly profit (revenue minus expense)
- Running (year-to-date) profit
- Budget variance (actual vs. budgeted, in absolute and percentage terms)
- Expense ranking by department
- Profit ranking by department or business unit
- Month-over-month expense volatility
Typical Dashboards
- Budget vs. Actual Dashboard — monthly and year-to-date variance between actual and budgeted figures, by department.
- Profitability Leaderboard — ranks departments or business units by profit contribution.
- Running Profit Tracker — year-to-date cumulative profit, presented alongside the annual target.
- Expense Volatility Report — flags departments whose month-over-month expense swings exceed a materiality threshold.
Business Problems
- “Rank our departments by profit contribution this quarter.”
- “Rank departments by expense - which teams are the largest cost centers?”
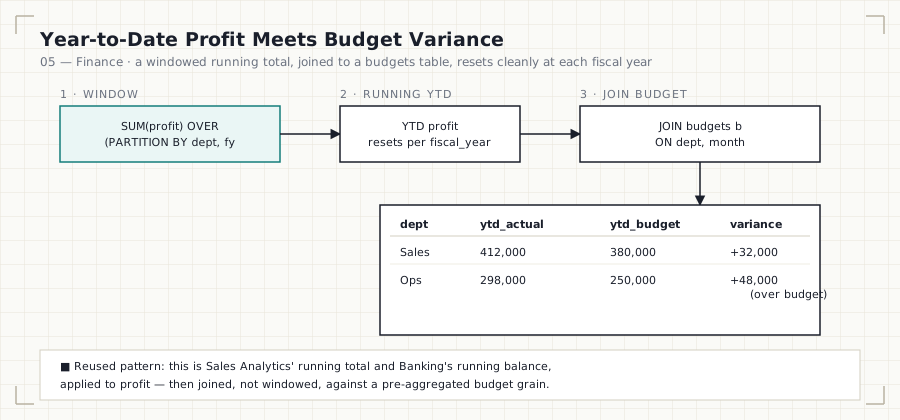
- “Show running (year-to-date) profit, department by department, and company-wide.”
- “How does actual spend compare to budget, month by month, for every department?”
- “Which departments had the largest swing in expense from one month to the next?”
- “Build a financial leaderboard that’s reusable for any month or quarter.”
Why Window Functions Are Needed
Every pattern in this chapter has already been introduced - RANK()/DENSE_RANK() for leaderboards (Chapters 01-03), running totals for year-to-date profit (Chapter 02’s running revenue, Chapter 04’s running balance), and LAG() for period-over-period comparison (Chapter 02’s MoM/YoY growth). Finance simply layers a budget comparison on top - typically via a join to a budgets table rather than a new window function - which is why this chapter also serves as a review of everything covered so far, applied to the domain where leadership scrutiny is highest.
Functions Used in This Chapter
| Function | Business Explanation |
|---|---|
RANK() / DENSE_RANK() |
Department leaderboards by profit and by expense. |
SUM() OVER (... ROWS BETWEEN UNBOUNDED PRECEDING AND CURRENT ROW) |
Running (year-to-date) profit, per department and company-wide. |
LAG() |
Month-over-month expense comparison and volatility flagging. |
Window function + join to budgets |
Actual-vs-budget variance reporting. |
SQL Concepts Reinforced
- Reusing the exact running-total frame clause from Sales Analytics (Chapter 02) and Banking (Chapter 04), now applied to a
profitcolumn derived fromrevenue - expenserather than a raw transaction amount. - Combining a windowed running total with a joined budget figure to compute year-to-date variance - a pattern that mixes window functions with standard joins rather than relying on window functions alone.
- Using
LAG()to compute month-over-month expense deltas, then flagging any delta beyond a fixed materiality threshold (a common audit and governance pattern). - Reinforcing that
RANK()vs.DENSE_RANK()choice affects how tied departments appear on a leaderboard shown to executives - a seemingly cosmetic choice with real communication consequences in a board deck.
Performance Notes
- Running year-to-date profit calculations reset conceptually at the start of each fiscal year - ensure the partition includes the fiscal year (e.g.,
PARTITION BY department_id, fiscal_year) so the running sum does not silently carry over from the prior year’s final balance. - Joining a windowed actuals query to a
budgetstable is cheapest when both are pre-aggregated to the same grain (e.g., department + month) before the join, rather than joining at the raw transaction grain and aggregating afterward. - Variance reporting is typically requested at month-end close on a recurring schedule - consider materializing the actual-vs-budget variance as a scheduled view or table rather than recomputing it live from raw transactions for every dashboard refresh during the close process, when many stakeholders may query it simultaneously.
Common Mistakes
- Failing to reset a running (year-to-date) total at each fiscal year boundary, causing December’s running profit to silently include January of the following year - or vice versa - depending on how the partition is defined.
- Computing budget variance as
actual - budgetin one report andbudget - actualin another within the same organization, causing sign confusion in board materials - standardize on one convention (typicallyactual - budget, where positive means over budget for expenses) and document it. - Ranking departments by raw expense without considering department size or headcount, leading to a “largest cost center” ranking that simply reflects department size rather than spending efficiency.
- Using
LAG()for month-over-month expense comparison without excluding partial months (e.g., the current, still-in-progress month), which artificially inflates or deflates the calculated volatility.
Interview Questions
- “How would you calculate year-to-date profit per department, ensuring it resets correctly at each fiscal year boundary?” — Expect
SUM(profit) OVER (PARTITION BY department_id, fiscal_year ORDER BY transaction_month ROWS BETWEEN UNBOUNDED PRECEDING AND CURRENT ROW). - “How would you compute budget variance using SQL, and what does a positive vs. negative variance mean for expenses versus revenue?” — Expect a join between actuals and budgets at a common grain,
actual - budget, and a clear explanation that a positive expense variance is unfavorable while a positive revenue variance is favorable. - “How would you flag departments with unusually volatile month-over-month expenses?” — Expect
LAG(expense) OVER (PARTITION BY department_id ORDER BY month)followed by a percentage-change calculation compared against a materiality threshold. - “Why might
RANK()produce a misleading department leaderboard for an executive presentation?” — Expect a discussion of tie-skipping behavior and whenDENSE_RANK()orROW_NUMBER()(with a documented tiebreaker) is more appropriate. - “How is this chapter’s running-profit pattern the same as, or different from, the running revenue pattern in Sales Analytics?” — Expect recognition that the SQL pattern (a framed
SUM() OVER (...)) is identical; only the underlying business metric (profit vs. revenue) and partition grain (department vs. salesperson) differ.
Summary
Finance is the capstone domain of this module because nearly every pattern introduced in Chapters 01-04 reappears here in service of the metric leadership scrutinizes most closely: profit. Running totals, leaderboards, and period-over-period comparisons combine with budget joins to produce the actual-vs-budget variance reports that drive monthly business reviews - and by this point, you should recognize the underlying SQL pattern before you even finish reading the business question.
Further Practice
- Extend the year-to-date profit query to project full-year profit using the current run-rate (year-to-date profit divided by months elapsed, multiplied by 12).
- Add a query that ranks departments by budget variance percentage rather than absolute variance, to surface departments that are proportionally furthest off plan regardless of their size.
- Build a rolling 3-month average expense query per department, and compare it to the single-month
LAG()volatility flag to see which signal catches issues earlier.
Next: 05_FINANCE.sql — the fully engineered SQL chapter for this domain, and the final chapter of Module 08.
Previous: 04_BANKING.md · Module: README · Next module: 09_Date_Functions ➡