SQL-Engineering-Handbook
02 · Sales Analytics — Window Functions in Revenue Reporting
Introduction
Sales organizations run on cadence: monthly quotas, quarterly targets, year-over-year growth commitments to the board. Almost every metric a sales leader looks at is a comparison over time or a ranking against peers — and both are core window function use cases.
This chapter shifts focus from the grouped comparisons of HR Analytics (Chapter 01) to time-based comparisons: running totals, moving averages, and period-over-period growth. These patterns power nearly every revenue dashboard in existence.
Business Background
A typical sales schema centers on a transactional fact table:
sales (sale_id, salesperson_id, region_id, sale_date, revenue, ...)salespeople (salesperson_id, salesperson_name, region_id, ...)regions (region_id, region_name, ...)
Sales leadership consumes this data primarily through rollups over time (daily, monthly, quarterly, yearly) and rankings across people or regions.
Typical KPIs
- Monthly Recurring Revenue (MRR) / total monthly revenue
- Month-over-Month (MoM) growth
- Year-over-Year (YoY) growth
- Running (cumulative) revenue toward a quarterly or annual target
- Sales rep leaderboard, regional leaderboard
- Moving average revenue (smoothed trend line)
- Sales gap analysis (days between consecutive sales for a rep or account)
Typical Dashboards
- Revenue Leaderboard — ranks salespeople or regions by revenue for a given period.
- Growth Dashboard — MoM and YoY growth trends, typically shown alongside a moving average line.
- Quota Attainment Tracker — running revenue compared against a target, updated daily.
- Sales Velocity Report — gap analysis between consecutive deals per rep, used to flag stalled pipelines.
Business Problems
- “Who is our top salesperson this month, and every month this year?”
- “Build a monthly leaderboard - not just for this month, but reusable for any month.”
- “Show running revenue toward our quarterly target, updated per transaction.”
- “What’s our Month-over-Month and Year-over-Year growth?”
- “Rank our regions by revenue, but let me toggle between strict and dense ranking.”
- “Smooth out our daily revenue with a 7-day moving average so the trend line isn’t noisy.”
- “Find sales reps who have gone unusually long without closing a deal.”
Why Window Functions Are Needed
Time-based sales metrics require a row to “see” other rows around it in time - the previous month’s revenue (for MoM growth), the same month last year (for YoY growth), or a rolling window of preceding days (for a moving average) - all while keeping every period as its own row for charting. This is structurally identical to the HR “compare to peers” problem, except the partition and order are now built around time instead of department. LAG() becomes the primary tool for period-over-period growth, and framed aggregate windows (ROWS BETWEEN ...) become essential for running totals and moving averages.
Functions Used in This Chapter
| Function | Business Explanation |
|---|---|
RANK() / DENSE_RANK() |
Leaderboards for salespeople and regions, with explicit tie-handling semantics. |
SUM() OVER (... ROWS BETWEEN UNBOUNDED PRECEDING AND CURRENT ROW) |
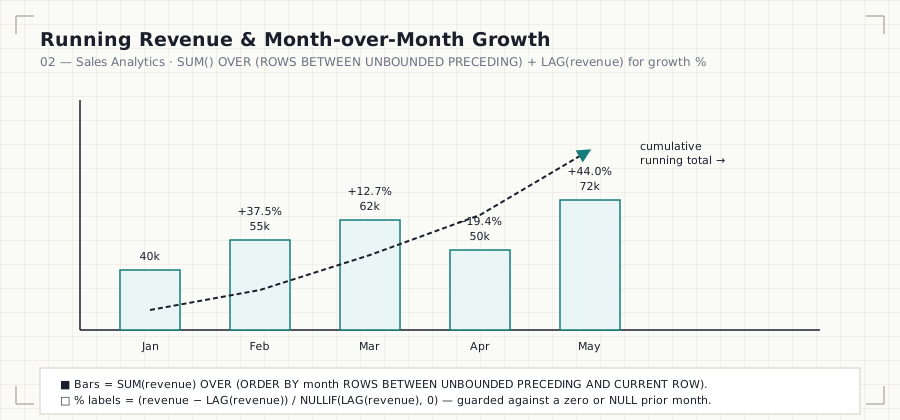
Running (cumulative) revenue toward a target. |
AVG() OVER (... ROWS BETWEEN N PRECEDING AND CURRENT ROW) |
Moving average revenue for trend smoothing. |
LAG() |
Retrieves prior period’s revenue for MoM / YoY growth calculations. |
DATEDIFF / date arithmetic with LAG() |
Computes the gap between consecutive sales for velocity analysis. |
SQL Concepts Reinforced
- Explicit frame clauses (
ROWS BETWEEN ... PRECEDING AND CURRENT ROW) and why the default frame (whenORDER BYis present but no frame is stated) can silently produce a running total instead of the full-partition total you may have expected. - Using
LAG()with an offset of 12 (LAG(revenue, 12)) to fetch “the same month, one year ago” from a monthly-grain table. - Computing growth percentages safely, guarding against division by zero / NULL prior periods with
NULLIF(). - The difference between partitioning by salesperson (per-rep running total) vs. no partition at all (company-wide running total).
Performance Notes
- Running totals and moving averages require the engine to maintain a sorted, incrementally-aggregated frame per partition; on very large fact tables, ensure
sale_date(or the relevant order column) is indexed alongside the partition key, e.g.,(salesperson_id, sale_date). - A
ROWS BETWEEN N PRECEDING AND CURRENT ROWframe is generally cheaper to compute than aRANGE-based frame, becauseROWSoperates on a fixed physical row count rather than re-evaluating value-based boundaries. - Avoid unnecessarily wide partitions (e.g., partitioning a 5-year daily table by nothing at all) when only regional or rep-level trends are needed - this forces the engine to sort and scan far more data than the business question requires.
- Materialize monthly/quarterly rollups as a separate aggregated table or view when dashboards query the same running-total pattern repeatedly; recomputing over raw transactional data on every dashboard refresh is expensive at scale.
Common Mistakes
- Omitting an explicit frame clause and assuming
SUM() OVER (PARTITION BY ... ORDER BY ...)always returns the full partition total - by default, with anORDER BYpresent, most engines apply an implicit running-total frame. - Computing YoY growth with a plain self-join instead of
LAG(revenue, 12)over a monthly grain, leading to fragile, hard-to-maintain SQL. - Dividing by a prior period’s revenue without guarding against zero or NULL, causing a growth calculation to error out or silently return NULL for legitimate rows.
- Ranking salespeople company-wide when the business actually wants a regional leaderboard - always confirm the partition scope matches the actual business ask.
- Using
RANK()for a leaderboard display where tied reps unexpectedly cause the next several ranks to be skipped, confusing a dashboard consumer expecting sequential ranks.
Interview Questions
- “Write a query to calculate running total revenue per salesperson, ordered by date.” — Expect
SUM(revenue) OVER (PARTITION BY salesperson_id ORDER BY sale_date ROWS BETWEEN UNBOUNDED PRECEDING AND CURRENT ROW). - “How would you calculate Month-over-Month growth in SQL?” — Expect
LAG(revenue) OVER (ORDER BY month)followed by a percentage-change calculation withNULLIFprotection. - “How is Year-over-Year growth different from Month-over-Month, in terms of implementation?” — Expect recognition that YoY on monthly data is
LAG(revenue, 12)rather thanLAG(revenue, 1). - “What’s the difference between a
ROWSframe and aRANGEframe in a window function?” — Expect an explanation thatROWScounts physical rows whileRANGEoperates on logical value ranges, which matters whenORDER BYvalues contain duplicates. - “How would you build a 7-day moving average of daily revenue?” — Expect
AVG(revenue) OVER (ORDER BY sale_date ROWS BETWEEN 6 PRECEDING AND CURRENT ROW).
Summary
Sales analytics reframes the window function toolkit around time rather than category. Running totals, moving averages, and lagged period comparisons are the backbone of every revenue dashboard - and once you can build them fluently, the same patterns transfer directly to finance and e-commerce reporting.
Further Practice
- Extend the MoM growth query to flag any month where growth exceeds ±20%, a common “material change” threshold for board reporting.
- Add a query that ranks regions by their trailing 3-month average revenue rather than a single month, to reduce noise in regional leaderboards.
- Build a sales velocity report using
LAG()to compute the number of days between consecutive deals per salesperson, and flag reps with unusually long gaps.
Next: 02_SALES_ANALYTICS.sql — the fully engineered SQL chapter for this domain.
Previous: 01_HR_ANALYTICS.md · Module: README · Next chapter: 03_ECOMMERCE.md