SQL-Engineering-Handbook
04 · ROLLUP, CUBE, and GROUPING SETS
🏠 Module Home · 🗂️ Handbook Home · ← 03 Conditional Aggregation · Next → 05 Business KPI Reports
Module: 02 — Advanced Aggregations Domain used in this file: Retail (
sales,stores,regions,products) Companion file:04_ROLLUP_CUBE_GROUPING_SETS.sql
Introduction
Every finance report you’ve ever seen with subtotal rows and a grand total at the bottom was built with one of three tools: ROLLUP, CUBE, or GROUPING SETS. Without them, producing subtotals means running several separate GROUP BY queries at different levels and manually stacking the results — slow, error-prone, and impossible to keep consistent as data changes between runs. This topic is where multi-column GROUP BY (Topic 01) grows into full hierarchical reporting.
Concept Overview
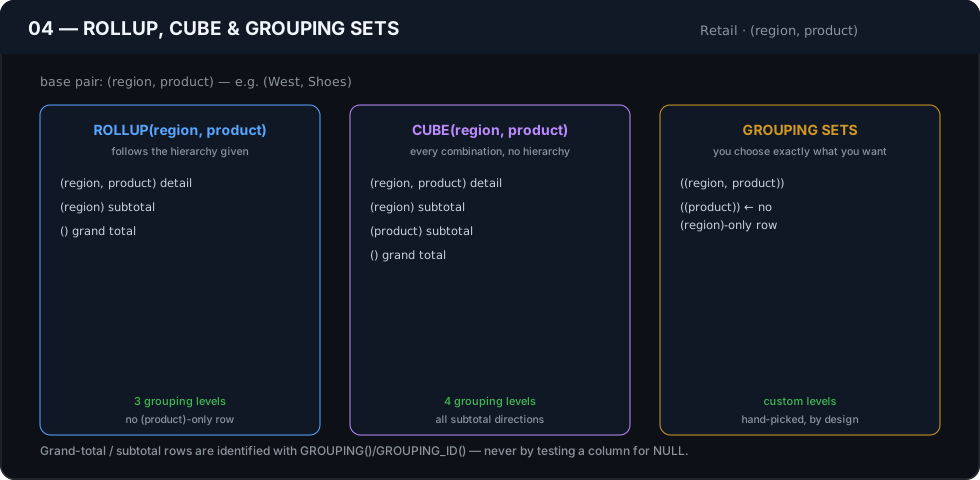
ROLLUP(a, b)produces the full detail grouped by(a, b), plus a subtotal grouped byaalone, plus one grand-total row — following the hierarchy of the column order given.CUBE(a, b)produces every possible combination of subtotals:(a, b),(a),(b), and the grand total — with no assumed hierarchy.GROUPING SETS ((a, b), (a), ())lets you specify exactly which combinations you want, by hand — including combinationsROLLUPandCUBEwouldn’t produce, like(b)alone without(a).
ROLLUP(a, b) is equivalent to GROUPING SETS ((a, b), (a), ()). CUBE(a, b) is equivalent to GROUPING SETS ((a, b), (a), (b), ()). GROUPING SETS is the general-purpose tool; ROLLUP and CUBE are convenient shorthand for its two most common shapes.
Business Motivation
A retail finance report needs: revenue per store per month, a subtotal per store across all months, and a company-wide grand total — all in one downloadable table, because that is exactly the shape a finance stakeholder expects to see in a spreadsheet or BI export. Building this by hand means three separate queries (detail, store subtotal, grand total) unioned together, with a real risk that the numbers drift out of sync if the underlying sales table is written to between queries. ROLLUP computes all three levels in a single, internally consistent aggregation pass.
Why This Feature Exists
SQL’s standard GROUP BY intentionally returns only one grain per query. ROLLUP, CUBE, and GROUPING SETS extend GROUP BY specifically to support the very common real-world need for multiple grains, with totals, in one result set — because that is the shape nearly every finance and executive report is expected to take, and recomputing it as several separate queries is both slower and harder to keep consistent.
Real Company Examples
- Retail chains — revenue by store and month, with store subtotals and a company grand total, in the monthly board report.
- Manufacturing — production volume by plant and product line, with plant-level and company-level totals for capacity planning.
- Telecom — subscriber counts by plan and region, with regional and national totals for regulatory reporting.
Business Problems Solved
- Financial statements and board reports requiring subtotals and grand totals
- Multi-level org-chart-style reporting (department → division → company)
- Any spreadsheet-style pivot table with row subtotals, produced directly by the database
- Dashboard export tables where the BI tool expects pre-computed totals rather than computing them client-side
Visual Explanation
ROLLUP(region, store)                       Hierarchy: region ▸ store ▸ (grand total)

┌────────┬──────────┬─────────┐
│ region │ store     │ revenue │
├────────┼──────────┼─────────┤
│ East    │ Store A   │ 40,000  │  ◀ detail
│ East    │ Store B   │ 35,000  │  ◀ detail
│ East    │ NULL      │ 75,000  │  ◀ subtotal for East (GROUPING(store) = 1)
│ West    │ Store C   │ 28,000  │  ◀ detail
│ West    │ NULL      │ 28,000  │  ◀ subtotal for West
│ NULL    │ NULL      │ 103,000 │  ◀ grand total (GROUPING(region) = 1)
└────────┴──────────┴─────────┘
CUBE(region, store) would additionally include a subtotal grouped by store alone (across all regions), which ROLLUP does not produce because it follows a strict hierarchy.
Syntax
-- ROLLUP: hierarchical subtotals following column order
SELECT region, store, SUM(revenue) AS total_revenue
FROM sales
GROUP BY ROLLUP(region, store);

-- CUBE: every possible subtotal combination
SELECT region, store, SUM(revenue) AS total_revenue
FROM sales
GROUP BY CUBE(region, store);

-- GROUPING SETS: hand-picked combinations only
SELECT region, store, SUM(revenue) AS total_revenue
FROM sales
GROUP BY GROUPING SETS ((region, store), (region), ());

-- GROUPING(): identify which columns are "rolled up" (NULL) in a given row
SELECT
    region, store, SUM(revenue) AS total_revenue,
    GROUPING(region) AS is_region_total,
    GROUPING(store)   AS is_store_total
FROM sales
GROUP BY ROLLUP(region, store);
Detailed Walkthrough
SELECT
    r.region_name,
    s.store_name,
    SUM(sa.revenue)                    AS total_revenue,
    GROUPING(r.region_name)            AS is_region_subtotal,
    GROUPING(s.store_name)             AS is_store_subtotal
FROM sales   AS sa
JOIN stores  AS s ON sa.store_id  = s.store_id
JOIN regions AS r ON s.region_id  = r.region_id
GROUP BY ROLLUP(r.region_name, s.store_name)
ORDER BY r.region_name, s.store_name;
- The engine first computes the full detail grain: one row per
(region, store). - It then adds a subtotal row per
region, withstore_nameset toNULL— this is whatROLLUPadds beyond a plainGROUP BY. - Finally, it adds one grand-total row with both
region_nameandstore_nameset toNULL. GROUPING(column)returns1on rows where that column has been “rolled up” intoNULLfor subtotal purposes, and0on genuine detail rows — this is how the presentation layer distinguishes a realNULLvalue from a subtotal marker.
Production Workflow
ROLLUP/CUBE/GROUPING SETS queries commonly feed directly into finance export tables, scheduled PDF/Excel report generation, or BI tools that expect pre-built subtotal rows (many BI tools can also compute subtotals client-side, but pushing it into SQL keeps the report reproducible and consistent regardless of which tool renders it).
Analytics Engineering Perspective
- Never hardcode a label like
'All Stores'into the data. UseGROUPING()to detect subtotal rows and apply the label in the presentation layer (COALESCE(store_name, CASE WHEN GROUPING(store_name)=1 THEN 'All Stores' END)), keeping the raw aggregation output clean and machine-readable. - Prefer
GROUPING SETSoverCUBEonce only specific combinations matter.CUBEon more than 3–4 dimensions grows to 2ⁿ combinations fast; an explicitGROUPING SETSlist is both cheaper and clearer about business intent. ROLLUP’s hierarchy depends on column order.ROLLUP(region, store)andROLLUP(store, region)produce different subtotal rows — the first subtotals by region, the second by store — this is a frequent source of confusion in code review.
Performance Considerations
ROLLUP(a, b)on two columns produces at most 3 grouping levels;CUBE(a, b)produces at most 4. Each additionalCUBEdimension doubles the number of grouping combinations (2ⁿ), soCUBEbeyond 3–4 columns can become expensive quickly.GROUPING SETScomputed explicitly is generally cheaper thanCUBEwhen only a handful of the possible combinations are actually needed, since the engine doesn’t compute combinations you didn’t ask for.- As with any
GROUP BY, ensureWHEREfilters the base rows before aggregation begins — subtotal and grand-total rows are computed from whatever rows survive theWHEREclause, not the full table.
Edge Cases
- Genuine
NULLvalues vs. subtotalNULLs look identical withoutGROUPING(). Ifstore_namecan legitimately beNULLin the source data (e.g., an online-only sale with no physical store), that row’sNULLis indistinguishable from aROLLUP-generated subtotalNULLunlessGROUPING()is used to tell them apart. HAVINGwithROLLUP/CUBE. Filtering withHAVING SUM(revenue) > 10000will also apply to subtotal and grand-total rows, potentially dropping a real subtotal that fails the same threshold as a detail row — check whether the filter should exempt subtotal rows usingGROUPING().- Column order matters for
ROLLUP, not forCUBEorGROUPING SETS(whose combinations are stated explicitly).
Common Mistakes
- Assuming
ROLLUPandCUBEproduce the same output —ROLLUPfollows a strict hierarchy;CUBEproduces every combination. - Hardcoding
'Total'/'All Regions'labels directly into query output instead of usingGROUPING()and applying labels in the presentation layer. - Using
CUBEon many columns without checking the resulting row count first, leading to a much larger and slower result set than intended. - Applying
HAVINGwithout accounting for how it affects subtotal and grand-total rows.
Best Practices
- Always include
GROUPING()columns (or an equivalentCOALESCEpattern) when aROLLUP/CUBEquery’s output will be consumed by anything other than a human reading raw SQL output. - Default to
ROLLUPwhen the report has a natural hierarchy (region → store); default toGROUPING SETSwhen it doesn’t, or when only specific combinations are needed; reach forCUBEonly when every combination is genuinely useful. - Test row counts before running
CUBEagainst a large, high-cardinality table in production. - Document the intended subtotal hierarchy directly above the query.
Interview Questions
- What is the difference between
ROLLUP(a, b)andCUBE(a, b)?ROLLUPproduces subtotals following the hierarchy(a,b) → (a) → ().CUBEproduces every combination:(a,b), (a), (b), (). - How do you tell a genuine
NULLvalue in the source data apart from aROLLUP-generated subtotalNULL? Use theGROUPING()function, which returns1for rolled-up (subtotal) columns and0for real data rows. - Why might
GROUPING SETSoutperformCUBEfor the same reporting need?GROUPING SETScomputes only the explicitly listed combinations, whileCUBEcomputes every possible combination (2ⁿ for n columns), many of which may not be needed. - What’s a risk of applying
HAVINGto aROLLUPquery without consideringGROUPING()? TheHAVINGcondition also applies to subtotal and grand-total rows, potentially filtering out a legitimate subtotal that happens to fail the same threshold as a detail row. - Is
ROLLUP(region, store)the same asROLLUP(store, region)? No —ROLLUP’s subtotal hierarchy follows column order, so the two produce different subtotal levels.
Summary
ROLLUP, CUBE, and GROUPING SETS extend GROUP BY to produce subtotals and grand totals in a single aggregation pass — exactly the shape financial and executive reports require. ROLLUP follows a hierarchy, CUBE produces every combination, and GROUPING SETS lets you specify exactly what you need by hand. GROUPING() is the tool that safely distinguishes a computed subtotal from a genuine NULL in the underlying data.
Practice Challenges
- Rewrite the walkthrough query using
CUBEinstead ofROLLUPand explain the extra row(s) it produces. - Rewrite the walkthrough query using
GROUPING SETSto produce only(region, store)and the grand total — skipping the region-level subtotal entirely. - Add a
COALESCE-based label column that reads'All Stores'on region subtotal rows and'Company Total'on the grand-total row, usingGROUPING(). - Explain what would go wrong if
HAVING SUM(revenue) > 50000were added to the walkthrough query without accounting forGROUPING(). - Design a
GROUPING SETSquery for a three-dimensional report (region, store, product category) that includes only region-level and store-level subtotals, skipping category-level and any two-way combinations.
Further Reading
- PostgreSQL Documentation — GROUPING SETS, CUBE, and ROLLUP
- MySQL 8.0 Reference Manual — GROUP BY Modifiers
- Microsoft Learn — GROUP BY (Transact-SQL): ROLLUP, CUBE, GROUPING SETS
◀ Previous: 03_CONDITIONAL_AGGREGATION.md · Next ▶ 05_BUSINESS_KPI_REPORTS.md