SQL-Engineering-Handbook
05 — Business Reporting Views
Module: 14 — Views Previous: 04 — View Security · Next: 06 — View Limitations
Learning Objectives
- Design Views intended to sit directly behind BI tools (Tableau, Looker, Power BI)
- Apply window functions and advanced aggregation inside View definitions
- Build a small semantic layer using layered Views
- Recognize the design contract a reporting View makes with its consumers
Concept Overview
A reporting View is a View engineered specifically to be the last stop before a dashboard — every column should be immediately usable by someone who has never seen the underlying schema. This is where everything from Modules 1–13 (window functions, date functions, advanced aggregation) gets composed into a single governed artifact.
Why This Exists
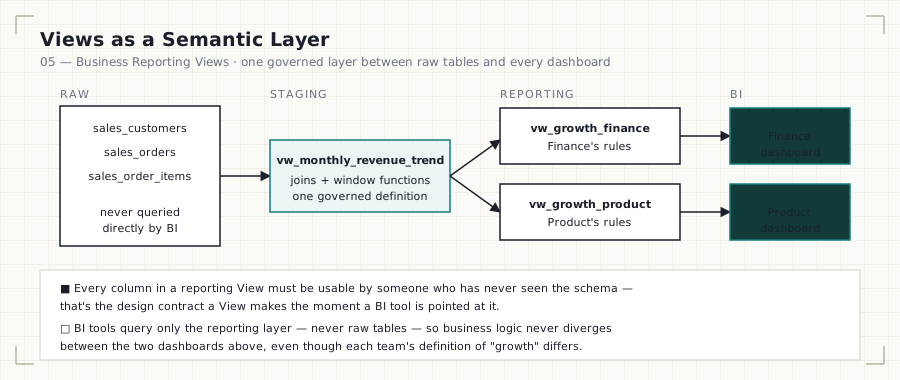
BI tools query whatever they’re pointed at, with whatever SQL the tool generates — usually simple SELECT/WHERE/GROUP BY. If a BI tool is pointed directly at raw normalized tables, either the BI team has to encode business logic redundantly in every dashboard, or the numbers across dashboards silently diverge. Reporting Views are the semantic layer that BI tools should be pointed at instead.
Business Context
A retail company’s leadership dashboard needs monthly revenue trend, customer segment breakdown, and month-over-month growth — all metrics that require window functions and multi-table joins. Rebuilding this logic per-dashboard in Tableau’s calculated fields leads to three different “monthly revenue” numbers across three teams. A single vw_monthly_revenue_trend View, built once by an analytics engineer, eliminates that.
Where Companies Use It
- Retail/E-commerce: monthly/quarterly revenue trend Views feeding executive dashboards
- SaaS: MRR/churn Views feeding board-report dashboards, built once and reused across Finance and Product
- Banking: account-balance trend Views feeding risk and compliance dashboards
- Marketing: campaign attribution Views combining multiple touch-point tables into one governed “conversion” definition
Real Business Example
CREATE OR REPLACE VIEW vw_monthly_revenue_trend AS
SELECT
    DATE_FORMAT(o.order_date, '%Y-%m') AS revenue_month,
    SUM(oi.quantity * oi.unit_price) AS monthly_revenue,
    LAG(SUM(oi.quantity * oi.unit_price)) OVER (ORDER BY DATE_FORMAT(o.order_date, '%Y-%m'))
        AS prior_month_revenue
FROM sales_orders AS o
INNER JOIN sales_order_items AS oi ON oi.order_id = o.order_id
WHERE o.status = 'COMPLETED'
GROUP BY DATE_FORMAT(o.order_date, '%Y-%m');
Syntax
Reporting Views use standard CREATE VIEW syntax — the engineering discipline here is in composition (window functions over aggregated results, layered Views), not new syntax.
Visual Explanation
┌─────────────────────────┐
│   BI Tool (Tableau etc.) │
└────────────┬─────────────┘
             │  simple SELECT/GROUP BY
             ▼
┌───────────────────────────────┐
│  vw_monthly_revenue_trend      │  ← semantic layer: window fns,
│  vw_customer_segment_summary   │     business rules, pre-joined
└────────────┬────────────────────┘
             │
             ▼
┌───────────────────────────────┐
│  Raw normalized base tables    │
└─────────────────────────────────┘
Step-by-Step Walkthrough
- Identify the metric definitions that recur across dashboards (revenue, active customers, churn) — these become View candidates before any dashboard-specific logic is built.
- Build the View using the full toolkit from Modules 1–13 — window functions for trend/growth,
CASEfor segmentation, NULL handling for clean output. - Validate the View’s output is dashboard-ready: no raw IDs without labels, no NULLs where a business user would expect zero, consistent date grain.
- Point the BI tool at the View, never at raw tables, for any metric with a governed definition.
Engineering Notes
Window functions inside a View definition are fully supported in MySQL 8.0+ and do not, by themselves, disqualify ALGORITHM = MERGE — but combined with GROUP BY (as in the example above), this View will use TEMPTABLE. That’s fine for a reporting View queried by a dashboard on a schedule; it would be a performance concern if nested inside a high-frequency OLTP-style query path. See Module 07.
Production Considerations
Reporting Views should have a named owner and a changelog — BI teams depending on stable column names and semantics need advance notice before a reporting View’s shape changes, the same way an API consumer needs notice before a breaking API change.
Performance Notes
Reporting Views are typically queried by dashboards on a schedule (minutes to hours), not in a tight application loop — this is the correct use case for TEMPTABLE-algorithm Views with aggregation and window functions, where read latency of a few hundred milliseconds is entirely acceptable.
Edge Cases
LAG()/LEAD()inside a View over a monthly grain will returnNULLfor the first row — decide explicitly (viaCOALESCE) whether the dashboard should showNULL,0, or omit the row, and document the choice.- Views combining multiple grains (daily transaction data joined to monthly targets) need explicit grain alignment or produce fan-out row duplication.
Best Practices
- Layer reporting Views: a
vw_completed_order_revenue(Module 01) feeding into avw_monthly_revenue_trend, rather than one enormous single View re-deriving everything. - Name columns exactly as a business user would expect to see them in a dashboard field list.
- Include a metric definition comment block at the top of every reporting View.
Common Mistakes
| Mistake | Consequence |
|---|---|
| One giant View trying to serve every dashboard | Unmaintainable, slow, unclear ownership |
| Exposing raw foreign keys without labels | BI tool users can’t self-serve without a data dictionary |
| No documented metric definition | Two teams build conflicting dashboards from the same View |
Interview Questions
- “How would you prevent two teams from calculating ‘active customer’ differently?” — a governed reporting View as the single source of truth, with BI tools pointed at it exclusively.
- “Would you compute month-over-month growth in the BI tool or in the View?” — in the View, so every dashboard consuming it gets a consistent, tested calculation.
Summary
Reporting Views are where the Handbook’s SQL toolkit converges into production BI-facing artifacts. They encode metric definitions once, are engineered for dashboard consumption, and form the foundation of a company’s semantic layer.
Practice Challenges
- Build
vw_customer_segment_summary, bucketing customers intoNew(signed up < 90 days ago),Active, andAt Risk(no completed order in 180 days) usingCASEand date functions. - Extend
vw_monthly_revenue_trendto include apct_growth_momcolumn usingprior_month_revenue, handling the first-monthNULLcase explicitly.
Further Reading
- MySQL 8.0 Reference Manual — Window Functions
- dbt Documentation — The Analytics Engineering semantic layer pattern