SQL-Engineering-Handbook
04 — Business Data Integration
Introduction
The previous two topics built the mechanics. This topic puts them to work on the job set operators exist for in most companies: producing one unified report from several structurally similar sources — regions, years, systems, or teams that each maintain their own table.
Concept Overview
Business data integration with set operators means: identify N tables (or filtered subsets of one table) that represent the same kind of business entity, align their columns, stack them with UNION ALL (almost always — this is a reporting/event context, not a deduplication one), and add a discriminator column identifying where each row came from.
Why This Exists
Organizations rarely centralize data collection perfectly. Regional offices keep regional tables. Fiscal years get archived into yearly tables. Two departments track the “same” thing in two systems that were never designed to talk to each other. Reporting still needs one unified view — set operators are how that unified view gets built without redesigning the underlying systems.
Business Context
A retail chain’s sales_us, sales_emea, and sales_apac tables share identical columns but live in different schemas because each region’s team owns their own reporting pipeline. Leadership wants one global sales dashboard. UNION ALL with a region discriminator column solves this in one query.
Real Company Examples
- A global retailer combines
sales_us,sales_emea,sales_apacinto oneSELECTfor an executive dashboard. - A SaaS company combines
subscriptions_legacy_billingandsubscriptions_new_billingduring a platform migration period when both systems are live simultaneously. - An HR team combines
employees_hqandemployees_acquired_companyinto one unified headcount report after a merger.
Production Use Cases
- Cross-region reporting.
- Cross-year / historical reporting (this year’s live table + last year’s archive table).
- Multi-system reporting during a migration’s transition period.
- Consolidating departmental rosters or directories after an org change.
Visual Explanation
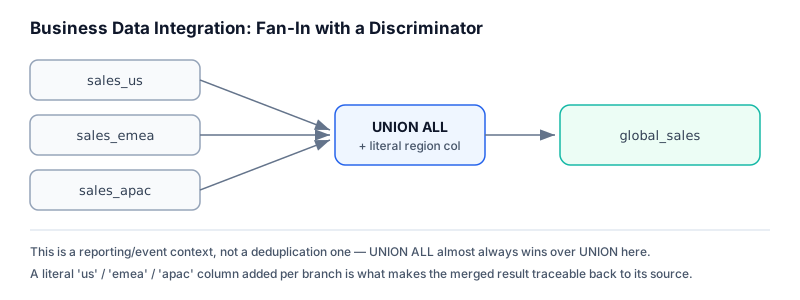
 sales_us    ──┐
 sales_emea  ──┼── UNION ALL ──► one unified "global_sales" result
 sales_apac  ──┘                  (+ a literal 'region' column per branch)
Syntax
SELECT column_list, 'us'   AS region FROM sales_us
UNION ALL
SELECT column_list, 'emea' AS region FROM sales_emea
UNION ALL
SELECT column_list, 'apac' AS region FROM sales_apac;
Detailed Explanation
The discriminator column — a literal string or code identifying the source branch — is what separates a merely-functional integration query from a production-quality one. Without it, once three sources are stacked into one result set, there is no way for a downstream consumer to trace a row back to its origin, which becomes critical the moment someone asks “wait, which region is driving this spike?”
SELECT emp_name, dept_name, 'HQ' AS source_system FROM employees_hq
UNION ALL
SELECT emp_name, dept_name, 'Acquired' AS source_system FROM employees_acquired;
Business Examples
-- Unified company directory: current employees and departments, one list,
-- duplicates preserved (an audit-facing report, not a dedup list)
SELECT emp_name AS directory_name, 'employee'   AS entity_type FROM employees
UNION ALL
SELECT dept_name AS directory_name, 'department' AS entity_type FROM departments;
-- Cross-year revenue report
SELECT order_id, order_total, 2024 AS fiscal_year FROM orders_2024
UNION ALL
SELECT order_id, order_total, 2025 AS fiscal_year FROM orders_2025;
Production Workflow
- Confirm every source table shares the same business entity shape (same columns, comparable types).
- Add a literal discriminator column per branch (region, year, source system).
- Default to
UNION ALL— integration reporting almost always needs every row preserved, since two branches by definition come from different sources and a “duplicate” is rarely a true duplicate. - Wrap the combined query in a view or CTE so downstream reports query one clean object instead of repeating the integration logic everywhere.
- Document, in the view/CTE definition, exactly which source tables feed it — this becomes the map future engineers use to trace data lineage.
Engineering Considerations
- A
UNION ALL-based integration view is one of the most common places aCREATE VIEWearns its keep — it hides the integration complexity from every downstream analyst. - When source tables have slightly different column names for the same concept (
amountvs.total_amount), aliasing to one canonical name in the integration layer is essential — this is where data contracts should be enforced. - If sources can add new columns independently, integration queries need active maintenance; a mismatched column count is a hard failure, not a silent one, which is actually a safety feature — you’ll know immediately when sources drift.
Performance Notes
UNION ALL across N sources is roughly the cost of N independent queries plus a cheap concatenation — no deduplication sort is involved. If the integration view is queried frequently, consider materializing it (a materialized view, or a scheduled table load) rather than recomputing the multi-source union on every request.
Database Compatibility
| Feature | MySQL | PostgreSQL | SQL Server | Oracle |
|---|---|---|---|---|
Literal discriminator column ('us' AS region) |
✅ | ✅ | ✅ | ✅ |
Views over UNION ALL |
✅ | ✅ | ✅ | ✅ |
| Materialized views | via triggers/manual | ✅ native | Indexed Views | ✅ native |
Best Practices
- Always add a discriminator column when integrating multiple sources.
- Default to
UNION ALLfor integration reporting; only deduplicate explicitly, and only when justified. - Centralize the integration logic in a view or model (e.g., a dbt model) so it isn’t copy-pasted across a dozen dashboards.
Common Mistakes
- Forgetting the discriminator column, then being unable to answer “which source did this row come from?” during an incident.
- Copy-pasting the same multi-source
UNION ALLlogic into every report instead of centralizing it once. - Using
UNIONinstead ofUNION ALLfor integration reporting, silently merging two legitimately distinct rows from different sources that happen to look identical.
Edge Cases
- If one source table is temporarily empty (e.g., a region with no sales yet this month), the integration query still runs correctly — an empty branch simply contributes zero rows.
- If a source table gains a new column that others don’t have, every branch must be updated to select (or default) that column — there is no automatic column reconciliation across branches.
Interview Questions
- (Foundational) Why is
UNION ALL, notUNION, the default choice when integrating regional or yearly report tables? - (Intermediate) What problem does a “discriminator column” solve, and why is it easy to forget?
- (Advanced) How would you design an integration view so that adding a fourth region next quarter requires touching only one place?
- (Staff-level) A global sales dashboard suddenly shows numbers 40% lower than finance’s reconciliation report. The dashboard is built on a
UNION ALLof three regional tables. Walk through your diagnostic approach.
Summary
Business data integration is where set operators earn their keep in day-to-day analytics: stacking structurally similar sources into one reportable view, almost always with UNION ALL, always with a discriminator column, and ideally centralized behind a single view or model.
Practice Problems
- Build a
UNION ALLquery combiningemployeesand a hypotheticalcontractorstable into oneall_personnelreport with aworker_typediscriminator column. - Extend the query in Problem 1 to include a
dept_namefor each person by joining todepartmentsinside each branch before theUNION ALL. - Explain, in a comment, what would break if a new
internstable were added next year with a differently-named ID column (intern_idinstead ofemp_id).
Further Reading
- Snowflake Documentation — Query Syntax: Set Operators
- dbt Developer Hub — patterns for unioning identical models across sources
- Google Cloud BigQuery Documentation —
UNION ALLand wildcard table patterns