SQL-Engineering-Handbook
08 — EXPLAIN & Execution Plans
Introduction
Every prior file has referenced EXPLAIN output without fully unpacking
it. This file is the complete reference: what every column means, how to
read a plan tree, and how the same concepts map across MySQL,
PostgreSQL, SQL Server, and Oracle.
Learning Objectives
- Read every column of MySQL’s
EXPLAINoutput - Explain the difference between
EXPLAINandEXPLAIN ANALYZE - Interpret rows, cost, loops, and actual vs. estimated time
- Recognize the key plan operators: index scan, sequential scan, nested loop, hash join, merge join
Business Motivation
A query that ran fine in staging times out in production. The schema is
identical; the row counts aren’t. EXPLAIN (and especially EXPLAIN
ANALYZE) is how you find out why — without it, you’re debugging
performance by guesswork.
Why This Exists
The optimizer’s chosen plan is invisible unless you ask for it.
EXPLAIN surfaces the plan without running the query; EXPLAIN ANALYZE
runs it and reports actual measured behavior against the plan’s
estimates — the gap between the two is often the most valuable
diagnostic signal available.
Production Use Cases
- Pre-deploy query review on any new or modified query touching a large table.
- Live incident debugging: “why is this query suddenly slow.”
- Validating that a new index is actually being used as intended (File 05’s covering-index verification is a direct application of this).
Architecture Discussion
EXPLAIN shows the estimated plan: what the optimizer intends to
do, based on statistics, without executing anything. EXPLAIN ANALYZE
executes the query and reports actual row counts, actual timing, and
actual loop counts alongside the original estimates — letting you spot
exactly where the optimizer’s assumptions diverged from reality.
Syntax
-- MySQL: plan only, no execution
EXPLAIN
SELECT * FROM orders WHERE customer_id = 88291;
-- MySQL 8.0.18+: adds actual execution stats
EXPLAIN
ANALYZE
SELECT * FROM orders WHERE customer_id = 88291;
-- PostgreSQL: plan only
EXPLAIN
SELECT * FROM orders WHERE customer_id = 88291;
-- PostgreSQL: executes and reports actual timing/rows
EXPLAIN ANALYZE
SELECT * FROM orders WHERE customer_id = 88291;
Syntax Breakdown
EXPLAINalone never executes the query — safe to run on production even for expensive queries.EXPLAIN ANALYZEdoes execute the query — use with caution on production for write-heavy or extremely expensive statements (it will actually perform anUPDATE/DELETEif youEXPLAIN ANALYZEone).
Visual Explanation — MySQL EXPLAIN Columns
id  select_type  table   type  key                   rows   Extra
1   SIMPLE       orders  ref   idx_orders_customer_id 5      Using index
- id — query block identifier (matters for subqueries/unions).
- select_type — SIMPLE, PRIMARY, SUBQUERY, DERIVED, etc.
- table — which table this row of the plan refers to.
- type — access method:
system>const>eq_ref>ref>range>index>ALL(roughly best to worst). - key — the index actually chosen (NULL if none).
- rows — estimated rows examined.
- Extra — critical flags:
Using index(covering),Using filesort(extra sort step),Using temporary(temp table needed).
ASCII Diagram — Plan Tree (Join Example)
Mermaid version (renders inline on GitHub without loading the SVG)
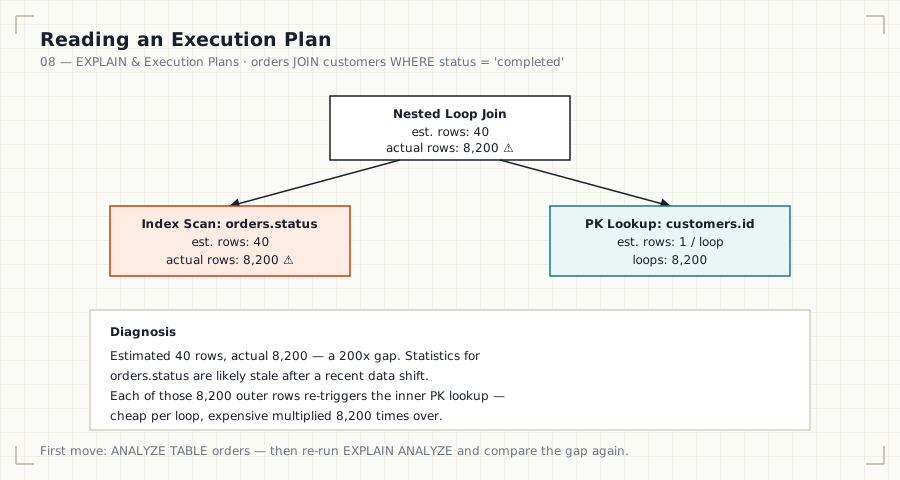
```mermaid flowchart TD A["Nested Loop Joinest. rows: 40 · actual rows: 8,200 ⚠"] --> B["Index Scan: orders.status
est. rows: 40 · actual rows: 8,200 ⚠"] A --> C["PK Lookup: customers.id
est. rows: 1/loop · loops: 8,200"] ```
EXPLAIN
SELECT o.order_id, c.email
FROM orders o
JOIN customers c ON o.customer_id = c.id
WHERE o.status = 'completed';
Plan tree (conceptual):
Nested Loop Join
/ \
Index scan Index/PK lookup
orders.status customers.id
(outer, driving) (inner, probed per outer row)
Execution Flow — Reading a Plan Bottom-Up
- Innermost/rightmost operations execute first conceptually (though
engines render this differently — PostgreSQL nests visually,
MySQL’s tabular EXPLAIN requires reading
id/nesting carefully). - Each operator’s
rows(estimated) vs.actual rows(with ANALYZE) tells you where the optimizer’s model diverged from reality. - Large gaps between estimated and actual rows are the single strongest signal of a statistics problem (File 07) rather than an indexing problem.
Engineering Notes
Loops (visible in EXPLAIN ANALYZE / PostgreSQL’s EXPLAIN ANALYZE)
tells you how many times an inner plan node executed — critical for
nested loop joins, where a small per-loop cost multiplied by millions of
outer rows becomes the dominant cost of the entire query, even though
each individual loop looks cheap in isolation.
Performance Notes
- Nested Loop Join: efficient when the outer side is small and the inner side has a supporting index — expensive when the outer side is large.
- Hash Join: builds an in-memory hash table from one side; strong for large, unindexed equi-joins, weak on memory-constrained systems with very large inputs.
- Merge Join: requires both inputs sorted (often via an index); efficient for large, pre-sorted equi-joins.
Storage Considerations
Plans themselves aren’t stored persistently in MySQL/PostgreSQL by
default (unlike SQL Server’s plan cache) — every EXPLAIN reflects
current statistics at call time, which is exactly why stale statistics
(File 07) matter operationally.
Optimizer Notes
cost (PostgreSQL’s EXPLAIN shows startup cost and total cost in
arbitrary units, not milliseconds) is a relative number for comparing
candidate plans — it is not directly a time prediction, which is why
EXPLAIN ANALYZE’s actual time figures matter for real diagnosis.
ANSI SQL Notes
EXPLAIN syntax and output format are entirely vendor-specific; the
ANSI standard has no EXPLAIN concept at all.
MySQL Notes
EXPLAIN FORMAT=JSONgives a much more detailed, machine-readable plan including per-step cost estimates.EXPLAIN ANALYZE(8.0.18+) returns a tree-formatted plan with actual timing embedded per node, replacing the older tabular-only output for this use case.
PostgreSQL Notes
EXPLAIN (ANALYZE, BUFFERS)additionally reports actual disk/cache buffer hits — extremely useful for diagnosing whether a query is I/O-bound or CPU-bound.- Plan nodes are rendered as an indented tree by default, generally more human-readable than MySQL’s tabular format.
SQL Server Notes
- “Actual Execution Plan” (graphical, in SSMS) is the equivalent of
EXPLAIN ANALYZE— includes actual vs. estimated row counts directly on each operator icon.
Oracle Notes
EXPLAIN PLAN FOR <query>followed bySELECT * FROM TABLE(DBMS_XPLAN.DISPLAY)is the standard two-step Oracle workflow for plan-only inspection.DBMS_XPLAN.DISPLAY_CURSORshows actual execution statistics for a query that has already run, analogous toEXPLAIN ANALYZE.
Edge Cases
- A query wrapped in a transaction that’s rolled back after
EXPLAIN ANALYZEstill had real side effects during execution (locks acquired, triggers fired) —EXPLAIN ANALYZEis not a safe dry-run mechanism for write statements. - Plans can differ between a cold cache and a warm cache — a plan captured immediately after a deploy may not represent steady-state production behavior.
Best Practices
- Use plain
EXPLAINfirst on production for any expensive-looking query; reserveEXPLAIN ANALYZEfor read-only statements or a safe staging replica. - Compare estimated vs. actual rows as the first diagnostic step for any unexpectedly slow query.
Anti-patterns
- Running
EXPLAIN ANALYZEon a productionDELETE/UPDATEwithout wrapping it in a transaction you intend to roll back — and even then, side effects like triggers and locks still occur. - Reading only the
type/access-method column and ignoringExtra(MySQL) or the buffers/timing detail (PostgreSQL).
Common Mistakes
- Treating estimated
rows/costas a direct time prediction. - Not noticing
Using filesortorUsing temporaryin MySQL’sExtracolumn — both indicate expensive steps beyond the index access itself.
Interview Questions
- What is the difference between
EXPLAINandEXPLAIN ANALYZE, and when would you avoid running the latter in production? - In MySQL’s
EXPLAINoutput, what doesUsing filesortin the Extra column tell you, and why is it a signal to investigate? - Compare Nested Loop, Hash, and Merge joins — under what conditions is each typically preferred by the optimizer?
- You see a large gap between estimated and actual row counts in an
EXPLAIN ANALYZEplan. What does that suggest, and what’s your next step?
Summary
EXPLAIN reveals the optimizer’s intended plan without running the
query; EXPLAIN ANALYZE runs it and reports actual measured behavior
alongside the original estimates. Reading a plan means understanding
access type (index vs. scan), join strategy (nested loop, hash, merge),
and the gap between estimated and actual rows — that gap is usually the
fastest path to diagnosing a real production performance problem.
Practice
See 12_PRACTICE_PROBLEMS.md, Production Debugging section, Problems 1–4.